
DEVELOPER TOOLS
Trace a user action all the way to shipped output.
Inspect state, reducers, layout, semantics, paint, resources, and device logs through the model the application actually runs. Diagnose the product without learning a separate hidden tooling model.
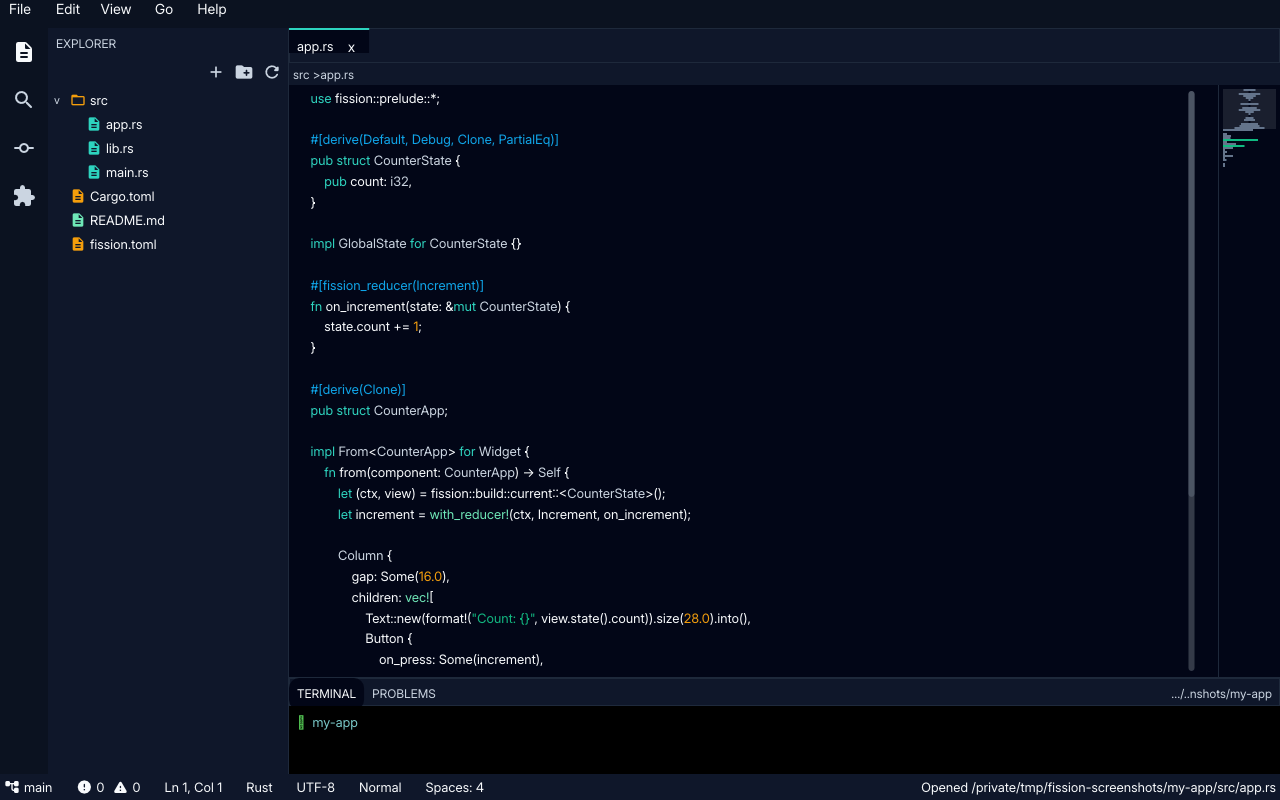
The editor example
OBSERVABILITY
Developer tools should explain real runtime behavior.
The debugging story centers on inspected output, action traces, layout facts, resource calls, screenshots, device logs, and IDE integration.
INSPECTOR
See the app model
Inspect widget output, Core IR, layout boxes, semantics, focus, hit testing, and paint order.
DIAGNOSTICS
Follow behavior
Trace actions, reducers, state snapshots, logs, resource calls, command output, and target diagnostics.
IDE WORKFLOW
Bring tools to the editor
Plugins should expose targets, tasks, diagnostics, inspector links, docs, and release checks where developers already work.
TOOLING DIRECTION
Make the app legible to humans and tools.
The goal is not a second programming model. The tools should reveal the Fission model already running in the app.
INSPECTOR
See what the runtime sees
The developer-tooling direction is to expose component output, layout boxes, semantics, paint order, focus state, hit testing, and route state.
Test and debug
TRACES
Follow actions through reducers
A useful tool should connect user input, action dispatch, reducer execution, state snapshots, resource calls, logs, and rendered output.
Diagnostics reference
EDITORS
Bring project context to the IDE
Plugins and agent tools should surface docs, targets, screenshots, layout inspection, test runners, and release checks where developers already work.
Developer workflow
DEBUGGING PATH
Inspect output, trace behavior, fix before release.
01
Inspect
Understand what widgets produced and how layout resolved.
02
Diagnose
Correlate actions, resources, logs, device output, and frame timing.
03
Improve
Use profiler and test output to fix performance and correctness issues before release.
Debug the architecture you ship
Tools should expose state, actions, reducers, layout, semantics, resources, logs, and target output without adding hidden behavior paths.