
CHARTS
Help people understand product data without embedding another UI stack.
Build dashboards, analytics, finance views, maps, and networks from typed Rust data. Charts share the product's theme, interaction model, tests, and target delivery instead of behaving like a foreign embed.
VISUALIZATION
Charts are product components, not decorative embeds.
The chart layer needs family breadth, dataset modeling, interaction, theming, animation, screenshots, and reference coverage.
BREADTH
Large chart catalog
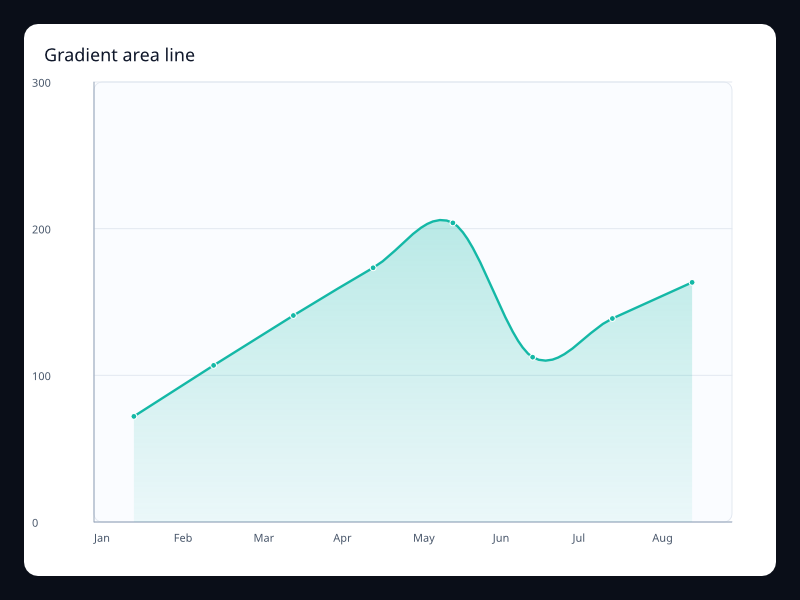
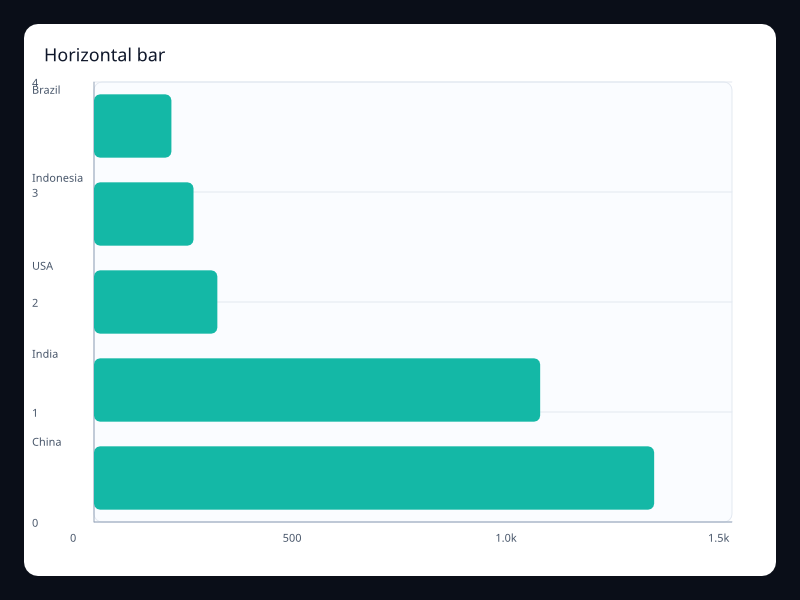
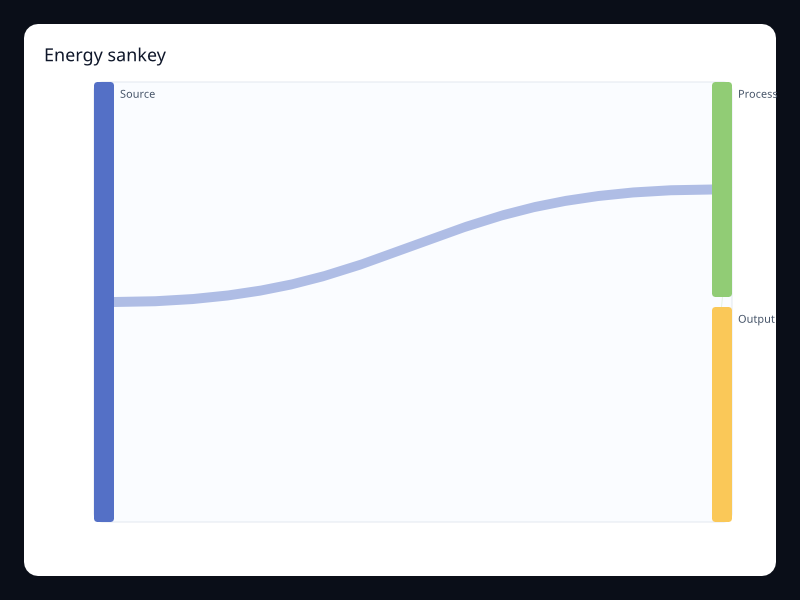
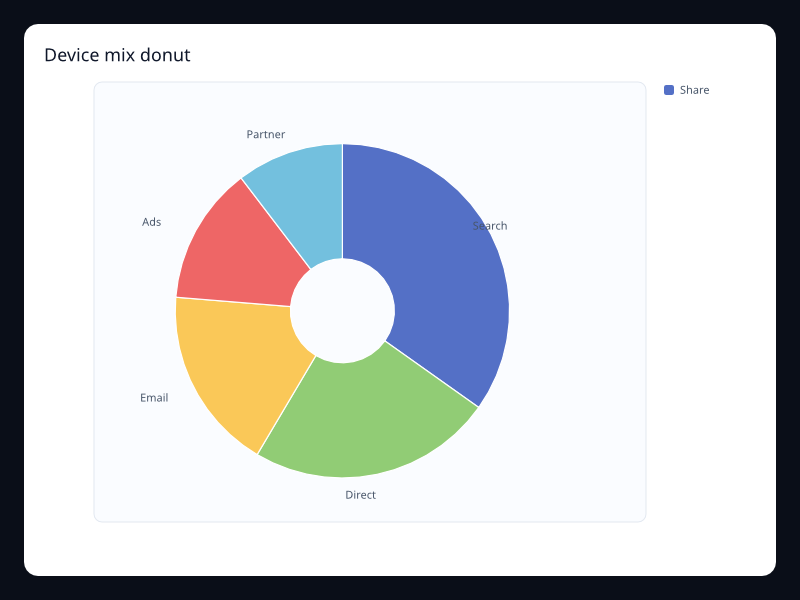
Line, bar, area, pie, scatter, heatmap, financial, relationship, map, component, dynamic, and 3D-oriented families.
PRODUCT FIT
Dashboards and analytics
Build monitoring, finance, operations, reporting, planning, and decision-support views without leaving Fission.
DESIGN
Theme-aware visuals
Charts consume the design system palette, typography, backgrounds, dark mode, and interaction rules.
CHART ARCHITECTURE
Start with the data story, then choose the visual form.
Production charts need the right family, typed data, interaction behavior, theme integration, and tests that prove the rendered output.
CATALOG
Choose a family deliberately
The reference catalog groups chart families and variants so dashboards can use the right visual form for comparison, trend, distribution, hierarchy, geography, or topology.
Chart catalog
DATASETS
Model data before visuals
Series and datasets define how data enters the chart, including static sets, streaming updates, and larger histories that should not be loaded all at once.
Series and datasets
INTERACTION
Tooltips, selection, and motion belong to the chart
Production charts need theme-aware animation, interaction rules, legends, toolboxes, hit testing, and screenshots that prove the output.
Chart interaction
CHART PATH
Choose a family, bind data, configure behavior, prove output.
01
Browse
Use the catalog to choose a family and variant.
02
Configure
Bind series, datasets, axes, legends, tooltips, interaction, and animation settings.
03
Ship
Document and test charts with generated screenshots and gallery examples.
Built for dashboards
The chart catalog is broad because production apps need reporting, monitoring, planning, financial, and decision-support views.