
Charts overview
Build polished native charts inside Fission apps.
Beautiful charts in the same Rust app model
Fission Charts is the native charting layer for Fission applications. It is designed for the same product work as the rest of the framework: dashboards, finance views, operational consoles, analytics surfaces, live status panels, and dense internal tools that need to run across Fission targets without becoming a separate JavaScript island.
A chart is just another Fission widget. It participates in layout, themes, state updates, tests, and platform hosts. You do not switch to a second runtime to draw a line chart or a network diagram. You describe the chart with typed Rust structures, Fission lowers it into its render model, and the host draws it through the normal rendering pipeline.
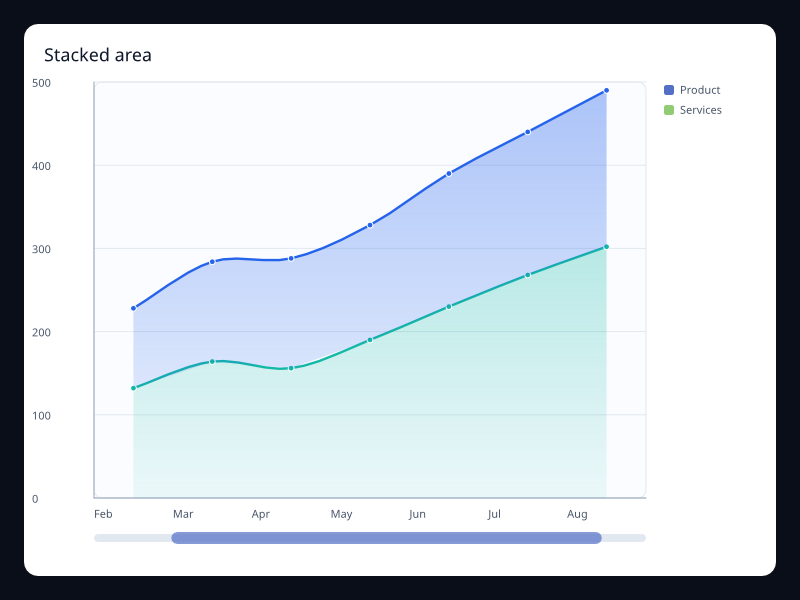
Stacked area
Family: Cartesian
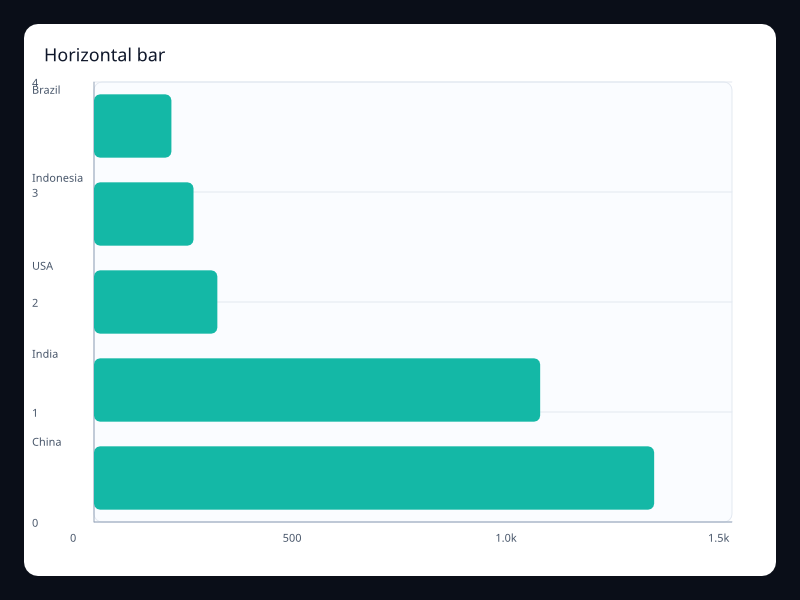
Horizontal bar
Family: Cartesian
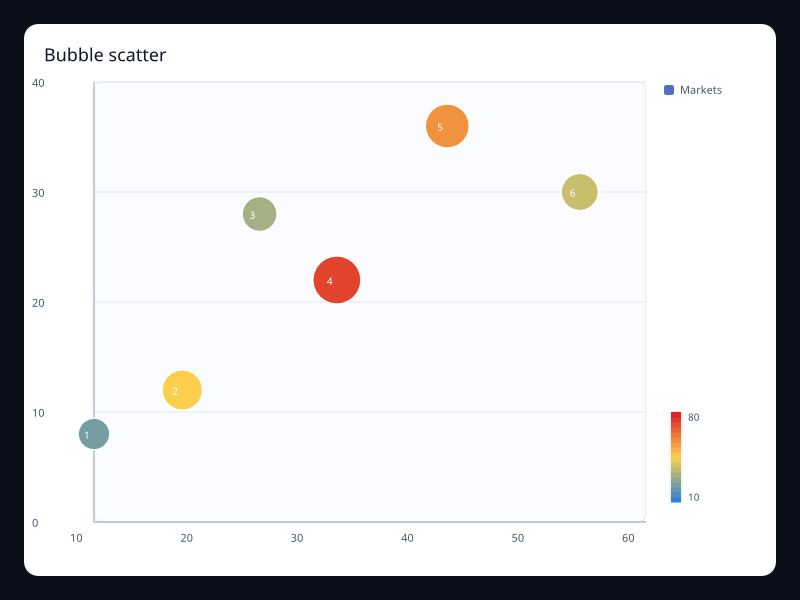
Bubble scatter
Family: Statistical And Finance
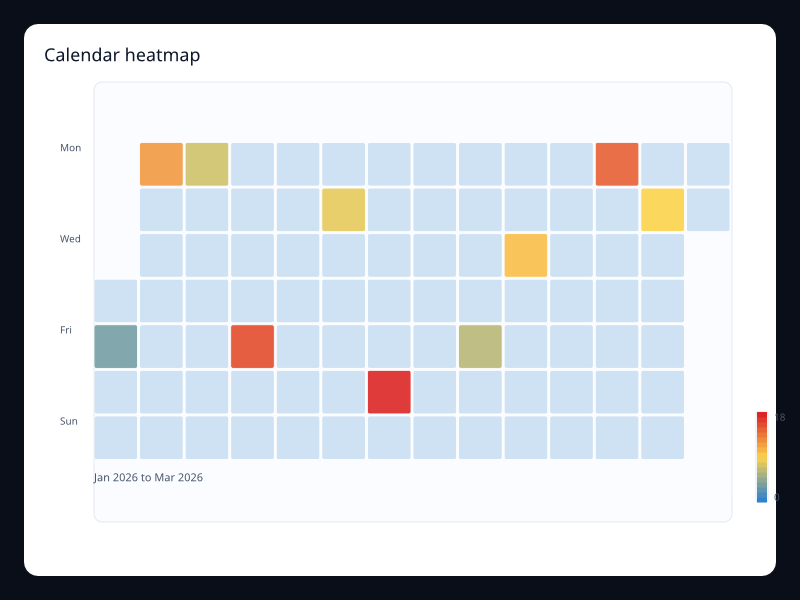
Calendar heatmap
Family: Coordinates
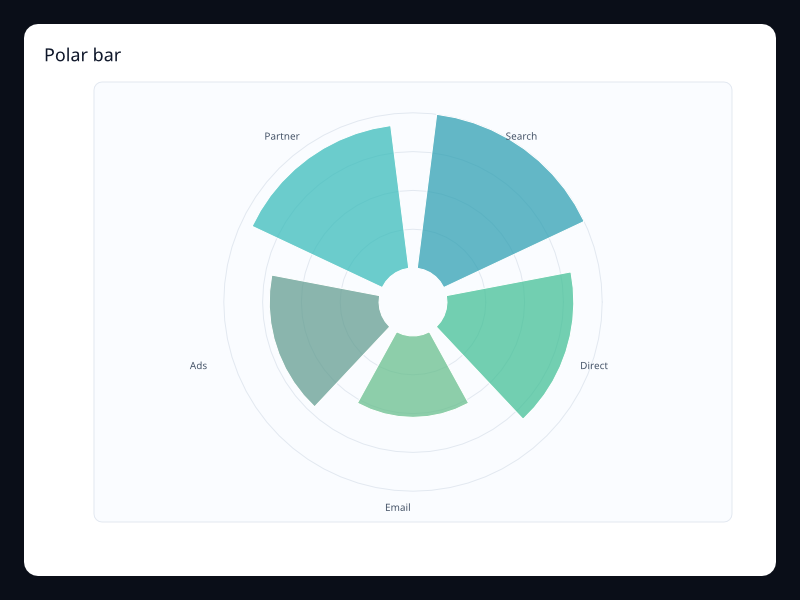
Polar bar
Family: Coordinates
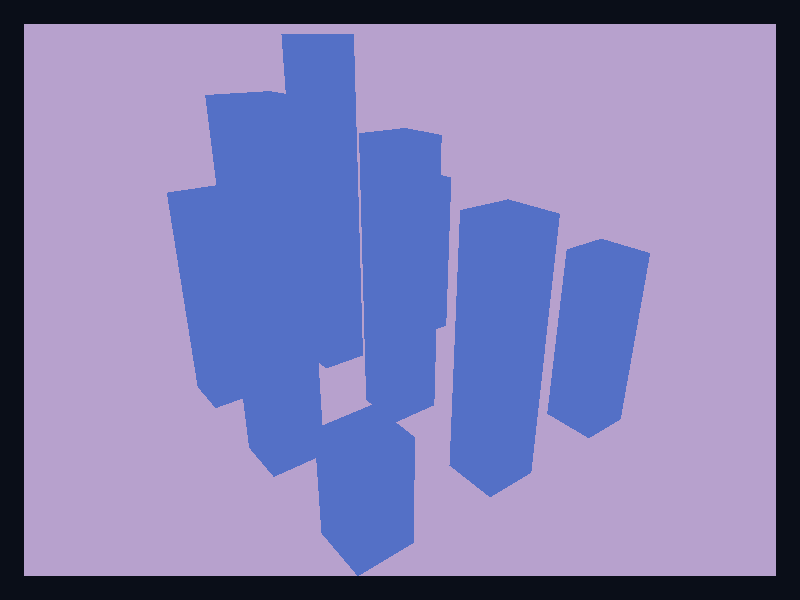
3D bar
Family: 3d And Gl
What you can build today
The current production slice covers more than 400 renderer-backed chart variants across the families most apps need first: line, large line, bar, horizontal bar, negative bar, area, step line, pie, donut, rose, scatter, bubble scatter, boxplot, candlestick, heatmap, calendar heatmap, radar, funnel, gauge, tree, treemap, sunburst, graph, sankey, theme river, parallel coordinates, choropleth maps backed by GeoJSON, route lines, pictorial bars, effect scatter, liquid fill, word cloud, dataset encoding, polar coordinates, single-axis event plots, legends, visual maps, mark points, mark lines, mark areas, data zoom, timeline, toolbox, brush selection, graphic overlays, and native 3D scene-backed chart examples for bars, scatter, lines, point clouds, globes, graphs, terrain, and surfaces.
Those features are intentionally implemented through the Fission chart model rather than copied from another charting API. The public surface is Rust-native, the rendering output is Fission-native, and unsupported series report diagnostics instead of pretending to work. The interaction and animation APIs are also typed Rust: charts can expose hit-tested events, selection/brush configuration, and deterministic animation timing without requiring a browser runtime.
Chart families
•
3d And Gl - 44 variants
•
Analytics - 20 variants
•
Bar - 38 variants
•
Cartesian - 13 variants
•
Components And Interaction - 23 variants
•
Coordinates - 4 variants
•
Data Pipeline And Interaction - 3 variants
•
Dataset - 20 variants
•
Dataset And Dynamic - 16 variants
•
Geo - 20 variants
•
Geo And Route - 10 variants
•
Geographic And Route - 4 variants
•
Heatmap - 20 variants
•
Heatmap And Calendar - 12 variants
•
Hierarchy - 19 variants
•
Hierarchy And Flow - 14 variants
•
Interaction - 20 variants
•
Line - 36 variants
•
Monitoring - 20 variants
•
Pie And Radial - 12 variants
•
Radial - 20 variants
•
Radial And Polar - 9 variants
•
Relationships And Hierarchy - 9 variants
•
Scatter And Statistical - 14 variants
•
Statistical - 20 variants
•
Statistical And Finance - 6 variants
Each family card opens the reference entry for that family. Use the guide pages to learn the concepts, then use the reference pages when you need a specific chart variant, screenshot, data shape, and API notes.
A chart is ordinary Fission UI
The shortest useful chart creates axes, adds one or more series, and returns the chart from component conversion. The surrounding screen can still use normal Fission layout widgets, reducers, commands, resources, and services.
use fission::prelude::*;
use fission::charts::{Axis, BarSeries, Chart, Legend, LineSeries, Tooltip};

#[derive(Default, Clone)]
struct DashboardState;

impl GlobalState for DashboardState {}

struct Dashboard;

impl From<Dashboard> for Widget {
    fn from(component: Dashboard) -> Self {
        let (ctx, view) = fission::build::current::<DashboardState>();
        Chart::new()
            .title("Weekly revenue")
            .x_axis(Axis::category(vec!["Mon", "Tue", "Wed", "Thu", "Fri", "Sat", "Sun"]))
            .y_axis(Axis::value())
            .legend(Legend::top_right())
            .tooltip(Tooltip::axis_trigger())
            .series(vec![
                BarSeries::new("Orders")
                    .data(vec![320.0, 332.0, 301.0, 334.0, 390.0, 330.0, 320.0])
                    .into(),
                LineSeries::new("Revenue")
                    .smooth(true)
                    .data(vec![120.0, 132.0, 101.0, 134.0, 90.0, 230.0, 210.0])
                    .into(),
            ])
            .into()
    }
}
The important part is the chart itself: typed axes, typed series, and a predictable model that the renderer can inspect and test.
Interaction and animation model
Charts participate in Fission input like other custom widgets. The chart model exposes typed interaction configuration for item events, selection modes, brush configuration, tooltip intent, toolbox actions, and keyboard focus. When event emission is enabled, the chart performs hit testing against the resolved chart model and dispatches a ChartInteractionEvent that tells your reducer which series item or plot area was targeted.
Animation is represented as chart data too. A ChartAnimation describes the animation kind, duration, delay, stagger, easing, and reduced-motion behavior. That keeps animated chart behavior deterministic and testable instead of hiding it behind ad-hoc timers. Renderer-specific animation effects are being added family by family so line growth, bar growth, radial sweeps, route effects, and data-update morphs all share the same timing model.
How to choose the right chart
Start with the question the user needs to answer. If the question is "how did this change over time?", start with line or area. If the question is "which category is larger?", start with bar. If the question is "how are parts contributing to a whole?", use stacked bars, stacked areas, pie, donut, treemap, or sankey depending on whether the structure is linear, radial, hierarchical, or flow-based.
Do not use a dramatic chart just because it looks impressive. A gauge is useful when the reader expects an instrument-like current state. It is a poor replacement for a line when the user needs history. A rose chart can be effective in a presentation, but a bar chart is often easier to compare. Fission Charts gives you expressive options, but production interfaces still need charts that answer the right question quickly.
Where the docs go next
The catalog documents the chart surface that is implemented today. Every entry uses a chart-only screenshot captured from the Fission chart gallery so readers see real renderer output rather than the gallery application shell. Use the catalog for quick selection, then open the family and variant reference pages for the data shape, Rust model, interaction notes, animation behavior, and testing guidance.
Lifecycle fit and verification
This page belongs to the setup, learn, build, test, and publish lifecycle. Use it to decide the next concrete action, then verify the action before moving to the next stage.
Stage question | Verification |
|---|---|
What file or command changes? | The page should point to the exact fission command, fission.toml section, Rust component, or generated artifact involved. |
What proves it worked? | Prefer a command output, generated file, screenshot, test assertion, package artifact, or deployed URL over a vague statement. |
What can fail safely? | Permission prompts, missing tools, unsupported hosts, invalid config, and expired credentials should produce diagnosable errors that can be retried after the cause is fixed. |
What should I read next? | Continue to the linked guide for step-by-step work or the reference page for exact fields and contracts. |
Previous
Workers and islands
Next
Chart catalog