
Chart catalog
The chart catalog is the visual index for Fission Charts. Use it when you know you need a chart but you are not yet sure which shape answers the user's question best.
Every card in this catalog is backed by a real Fission chart screenshot from the checked-in gallery assets. Entries stay out of the public catalog until the renderer, gallery, tests, and screenshot path exist. That rule keeps the documentation honest: when a chart appears here, it represents implemented Fission output, not a borrowed mockup or a promise.
How to use the catalog
Start from the question the user needs to answer.
If the question is about change over time, start with line, area, step line, or large-line variants. If the question is about comparing categories, start with bar or horizontal bar. If the question is about proportions, consider stacked bars, stacked areas, pie, donut, treemap, sunburst, sankey, or theme river depending on whether the structure is linear, radial, hierarchical, or flow-based. If the question is about spatial position, use geographic maps, route lines, globe views, or scatter/heatmap variants. If the question is about operational state, gauges, funnels, radar charts, status cards, or dense dashboard charts may fit better.
Open a variant page when a screenshot looks close. Each variant page explains the data shape, when to use it, the Rust model, interaction behavior, animation notes, and testing guidance.
What each card tells you
Card detail | Why it matters |
|---|---|
Screenshot | Shows actual Fission renderer output without the surrounding gallery shell. |
Family | Helps you move from one variant to related variants quickly. |
Data shape | Tells you what Rust data structure the chart expects. |
Use case | Explains the product situation where the visual form is useful. |
Tags | Helps search and filtering find related charts by purpose or interaction style. |
Do not choose a chart only because it looks impressive. A production chart should reduce the user's work. If a simpler bar, line, or table answers the question faster, choose the simpler form.
3d And Gl
3D bar

Bar values represented as retained native 3D scene primitives. Use it when depth and spatial grouping are part of the story, not as a default bar replacement.
Data: Typed chart data, axes, and series.
Use when: Use it when depth and spatial grouping are part of the story, not as a default bar replacement
Tags: 3d
3D capacity bars

3D bar scene for capacity values. Use it for spatial capacity displays.
Data: Typed chart data, axes, and series.
Use when: Use it for spatial capacity displays
Tags: 3d
3D grid bars

3D bars over a grid. Use it when depth and grouping are part of the data.
Data: Typed chart data, axes, and series.
Use when: Use it when depth and grouping are part of the data
Tags: 3d
Globe
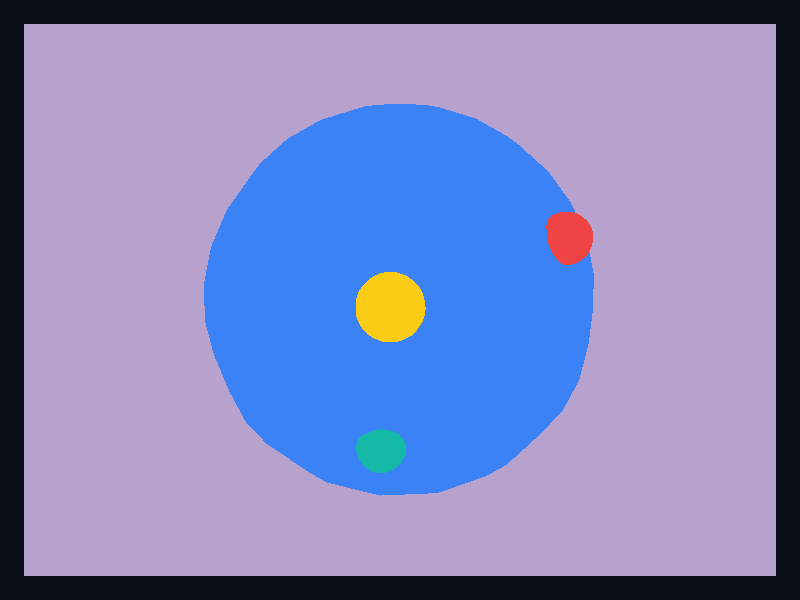
A spherical world-style chart primitive with highlighted locations. Use it when global shape and spatial orientation matter to the reader.
Data: Typed chart data, axes, and series.
Use when: Use it when global shape and spatial orientation matter to the reader
Tags: 3d
Globe coverage
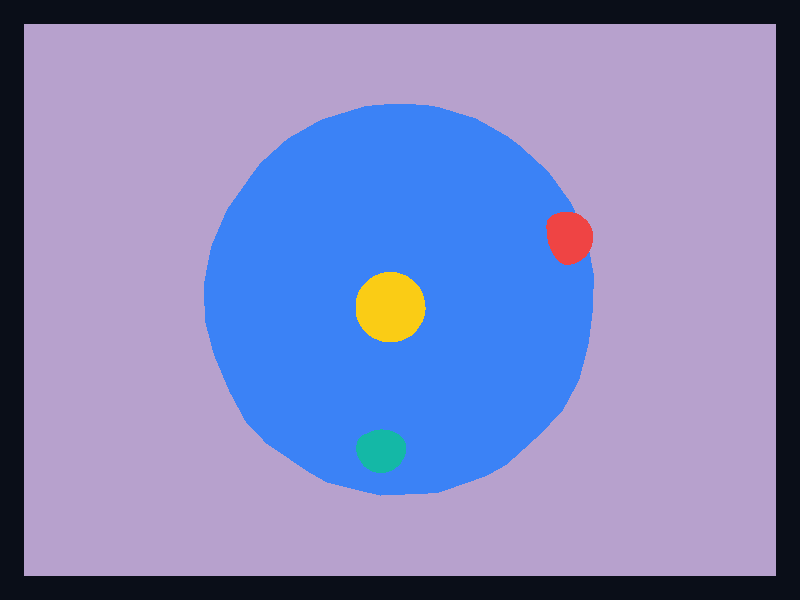
Globe variant for coverage displays. Use it for global product views.
Data: Typed chart data, axes, and series.
Use when: Use it for global product views
Tags: 3d
Globe markers
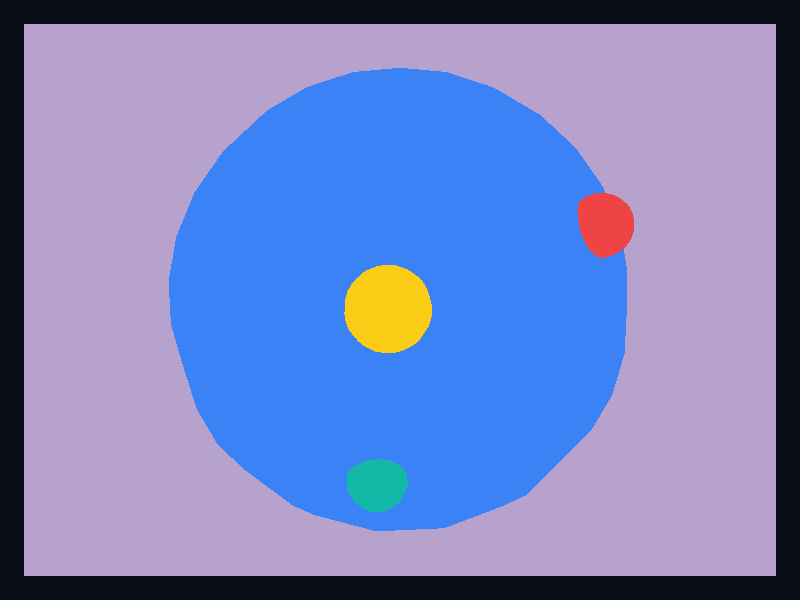
Globe primitive with marker locations. Use it for global context.
Data: Typed chart data, axes, and series.
Use when: Use it for global context
Tags: 3d
3D graph
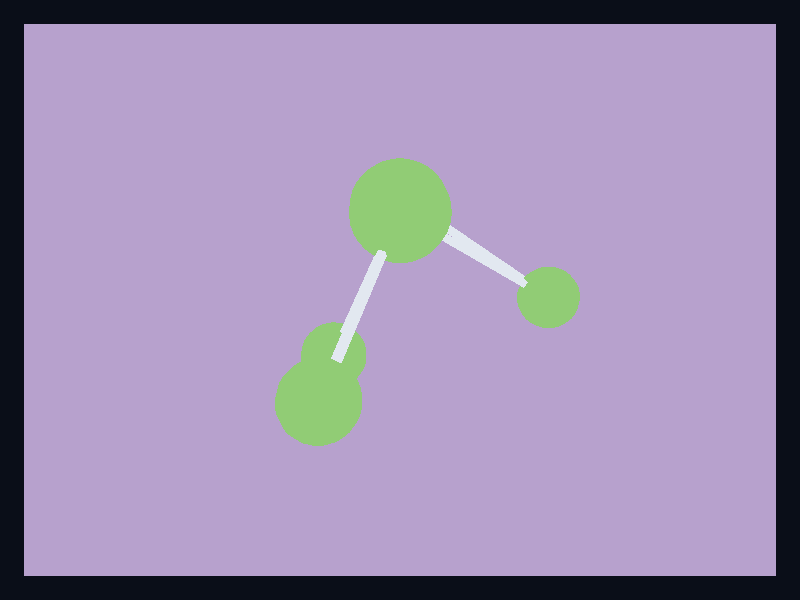
Relationship nodes placed in a native 3D scene. Use it when topology benefits from depth or when the graph is part of a 3D product surface.
Data: Typed chart data, axes, and series.
Use when: Use it when topology benefits from depth or when the graph is part of a 3D product surface
Tags: 3d
3D network
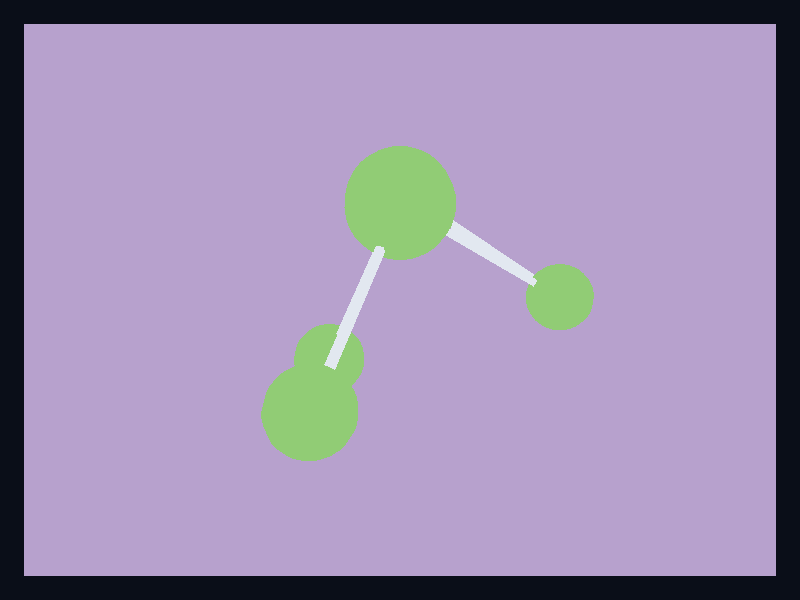
3D graph nodes and links. Use it for topology in depth.
Data: Typed chart data, axes, and series.
Use when: Use it for topology in depth
Tags: 3d
3D topology
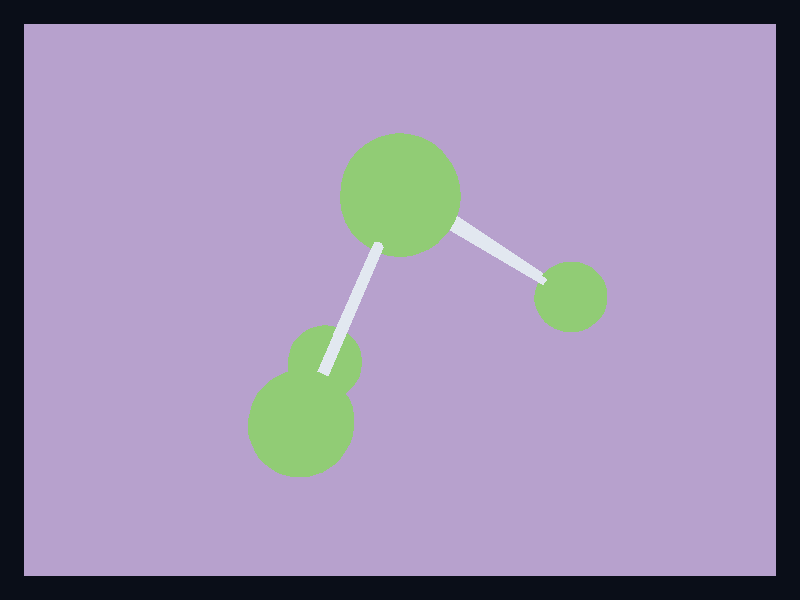
3D topology graph variant. Use it for spatial relationship maps.
Data: Typed chart data, axes, and series.
Use when: Use it for spatial relationship maps
Tags: 3d
3D line

A trajectory drawn through a native 3D scene using sampled points. Use it for paths, movement, and ordered spatial traces.
Data: Typed chart data, axes, and series.
Use when: Use it for paths, movement, and ordered spatial traces
Tags: 3d
3D spiral line

Spiral-like 3D line path. Use it for ordered spatial signals.
Data: Typed chart data, axes, and series.
Use when: Use it for ordered spatial signals
Tags: 3d
3D trajectory
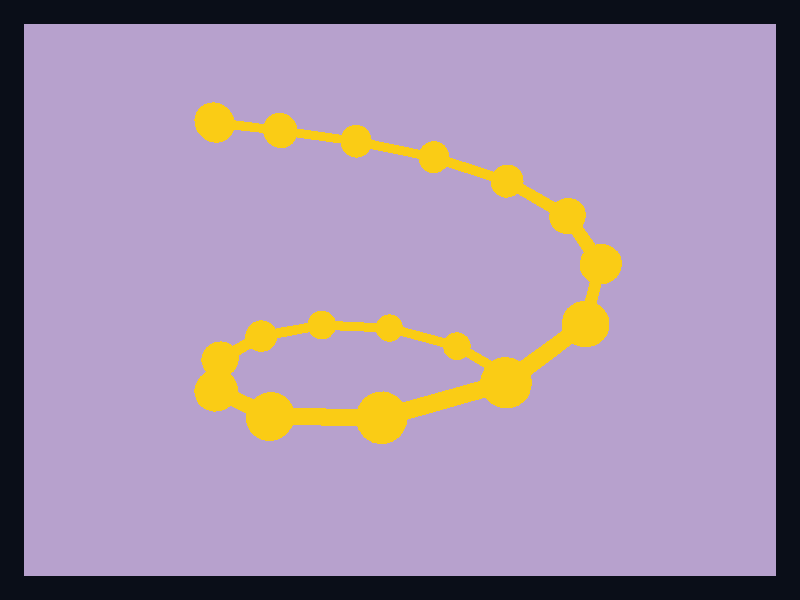
3D trajectory through sampled points. Use it for movement paths.
Data: Typed chart data, axes, and series.
Use when: Use it for movement paths
Tags: 3d
Mesh surface

Generic mesh-rendered surface. Use it for custom mesh data.
Data: Typed chart data, axes, and series.
Use when: Use it for custom mesh data
Tags: 3d
Dense point cloud
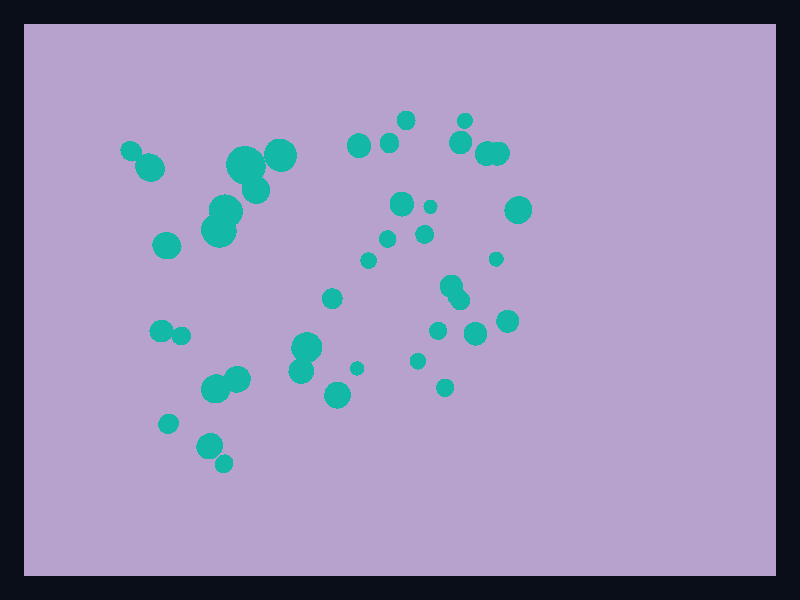
Dense cloud of spatial samples. Use it for scan-like data.
Data: Typed chart data, axes, and series.
Use when: Use it for scan-like data
Tags: 3d
Sparse point cloud
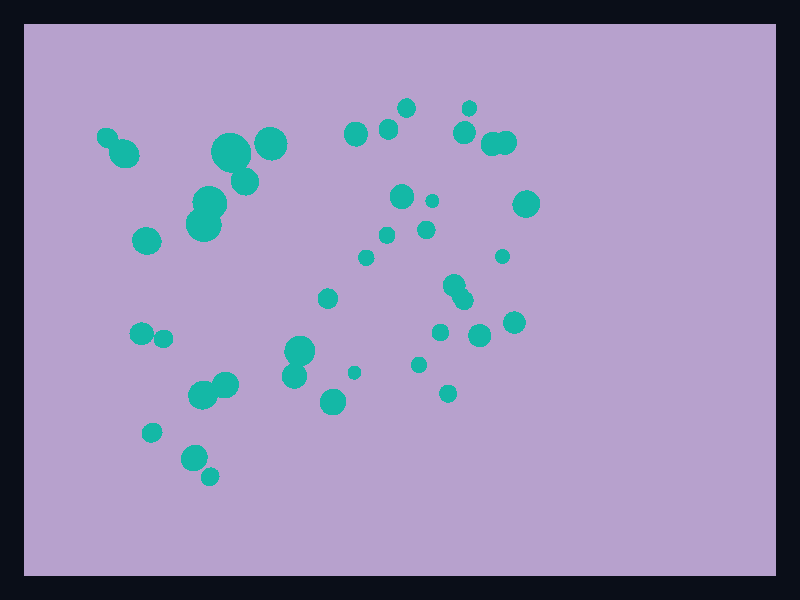
Sparse point cloud in 3D space. Use it for sampled spatial observations.
Data: Typed chart data, axes, and series.
Use when: Use it for sampled spatial observations
Tags: 3d
Point cloud
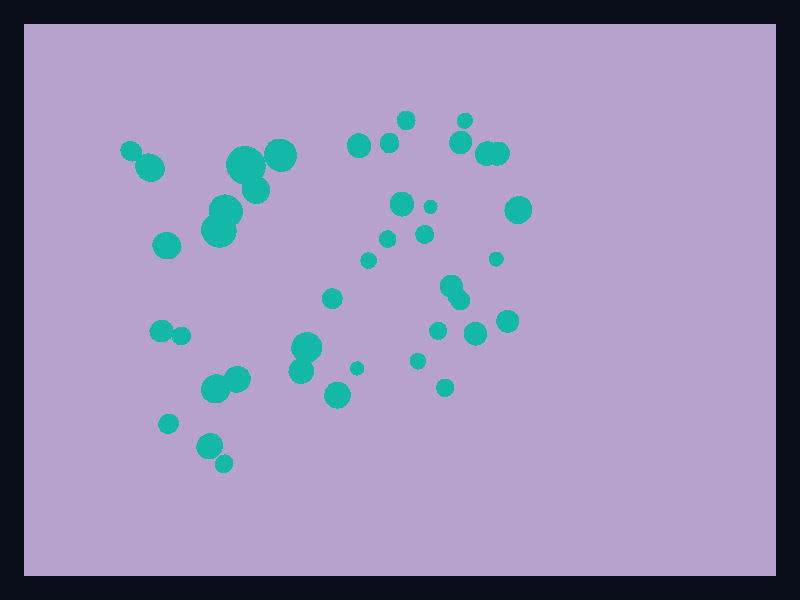
Many small points distributed in three-dimensional space. Use it for spatial samples, scan data, and dense 3D observations.
Data: Typed chart data, axes, and series.
Use when: Use it for spatial samples, scan data, and dense 3D observations
Tags: 3d
3D scatter
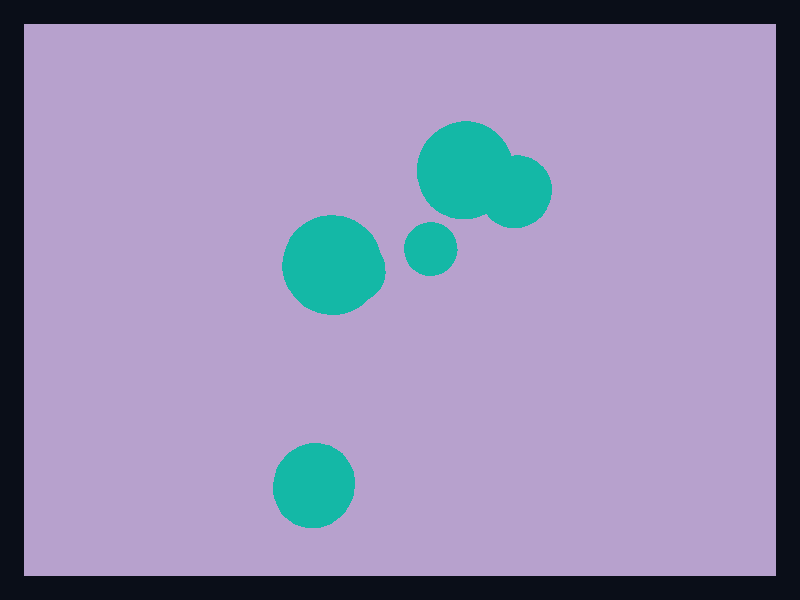
Points positioned in three dimensions with native scene primitives. Use it when all three dimensions are meaningful and the app benefits from spatial inspection.
Data: Typed chart data, axes, and series.
Use when: Use it when all three dimensions are meaningful and the app benefits from spatial inspection
Tags: 3d
3D scatter cluster
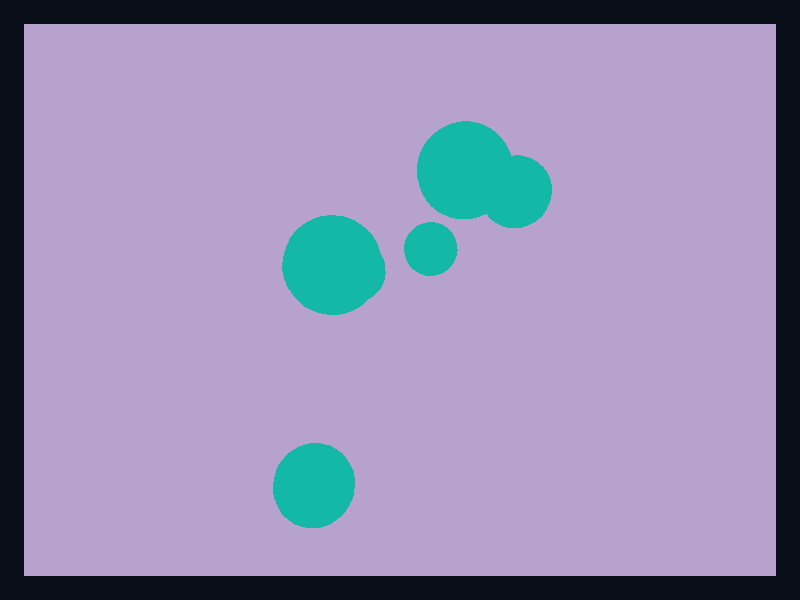
3D scatter points in a native scene. Use it for spatial sample clusters.
Data: Typed chart data, axes, and series.
Use when: Use it for spatial sample clusters
Tags: 3d
3D scatter outliers

3D scatter variant with separated points. Use it for spatial outlier inspection.
Data: Typed chart data, axes, and series.
Use when: Use it for spatial outlier inspection
Tags: 3d
3D capacity bars

3D capacity bars uses Fission Charts typed Rust data to render a production-ready 3d and gl view. Use it when depth is part of the visual story.
Data: Typed chart data, axes, and series.
Use when: Use it when depth is part of the visual story
Tags: 3d
3D grid bars

3D grid bars uses Fission Charts typed Rust data to render a production-ready 3d and gl view. Use it for spatial bar comparisons.
Data: Typed chart data, axes, and series.
Use when: Use it for spatial bar comparisons
Tags: 3d
3D globe coverage
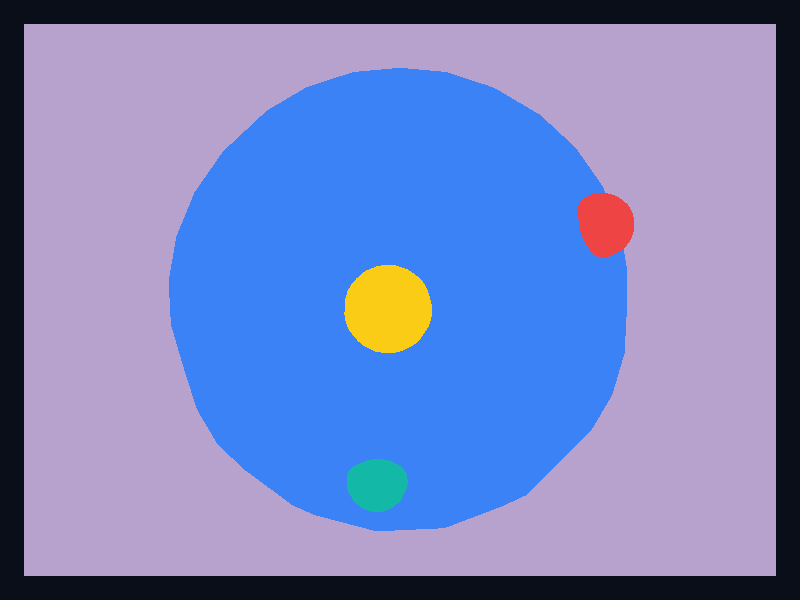
3D globe coverage uses Fission Charts typed Rust data to render a production-ready 3d and gl view. Use it for coverage and status over a globe.
Data: Typed chart data, axes, and series.
Use when: Use it for coverage and status over a globe
Tags: 3d
3D globe status
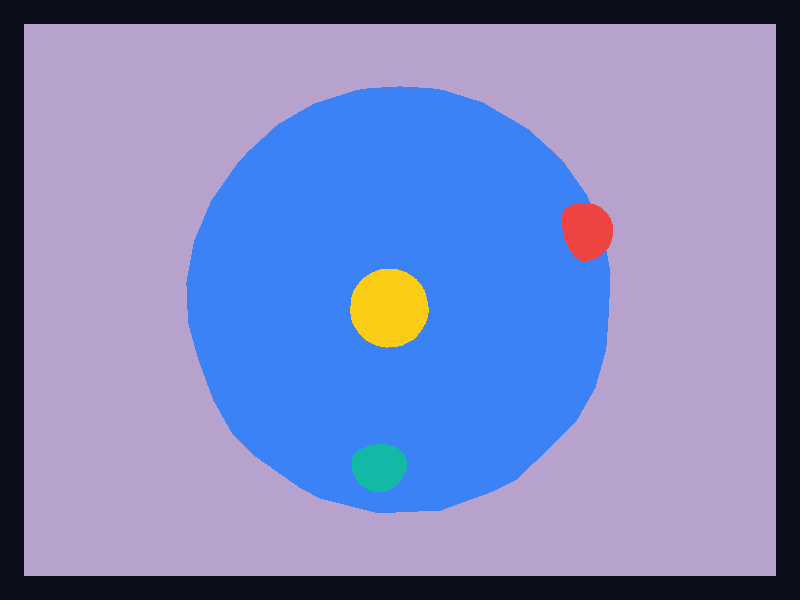
3D globe status uses Fission Charts typed Rust data to render a production-ready 3d and gl view. Use it when global context matters.
Data: Typed chart data, axes, and series.
Use when: Use it when global context matters
Tags: 3d
3D line path

3D line path uses Fission Charts typed Rust data to render a production-ready 3d and gl view. Use it for trajectories and movement.
Data: Typed chart data, axes, and series.
Use when: Use it for trajectories and movement
Tags: 3d
3D spiral path
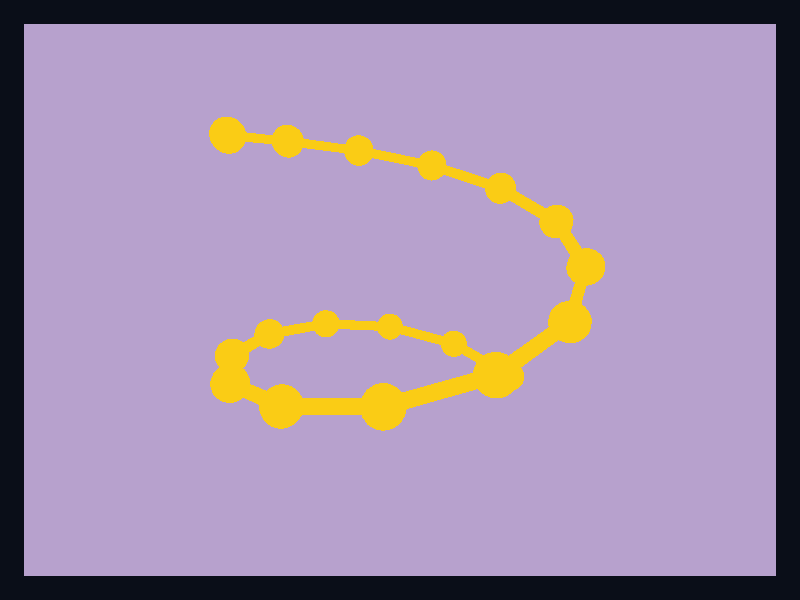
3D spiral path uses Fission Charts typed Rust data to render a production-ready 3d and gl view. Use it for trajectory demos and spatial flows.
Data: Typed chart data, axes, and series.
Use when: Use it for trajectory demos and spatial flows
Tags: 3d
3D mesh field

3D mesh field uses Fission Charts typed Rust data to render a production-ready 3d and gl view. Use it for custom mesh data.
Data: Typed chart data, axes, and series.
Use when: Use it for custom mesh data
Tags: 3d
3D network scene
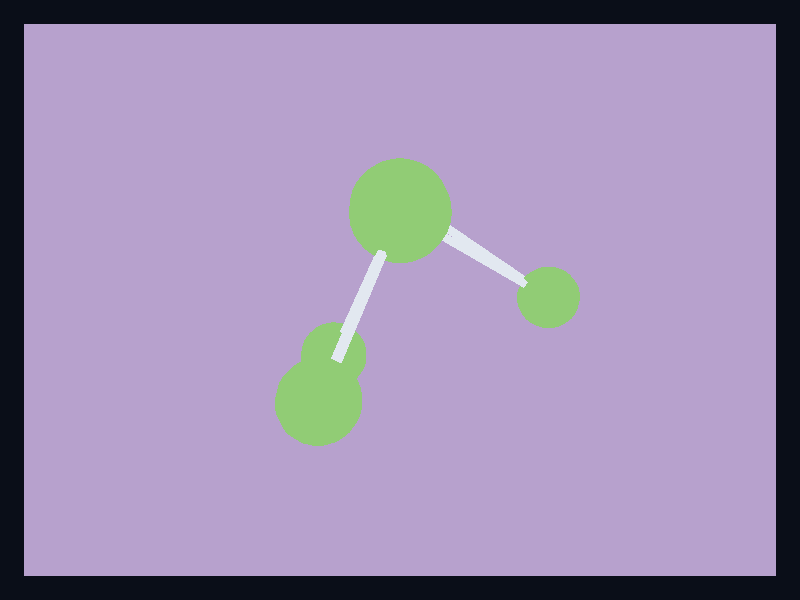
3D network scene uses Fission Charts typed Rust data to render a production-ready 3d and gl view. Use it for spatial network views.
Data: Typed chart data, axes, and series.
Use when: Use it for spatial network views
Tags: 3d
3D operations bars

3D operations bars uses Fission Charts typed Rust data to render a production-ready 3d and gl view. Use it when spatial placement helps compare operational metrics.
Data: Typed chart data, axes, and series.
Use when: Use it when spatial placement helps compare operational metrics
Tags: 3d
Dense 3D point cloud
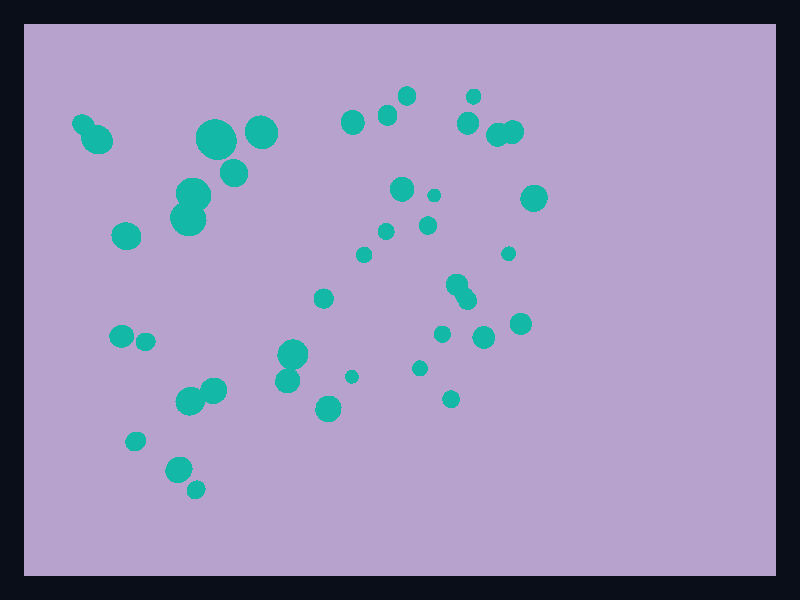
Dense 3D point cloud uses Fission Charts typed Rust data to render a production-ready 3d and gl view. Use it for point fields and early volume-style views.
Data: Typed chart data, axes, and series.
Use when: Use it for point fields and early volume-style views
Tags: 3d
Sparse 3D point cloud
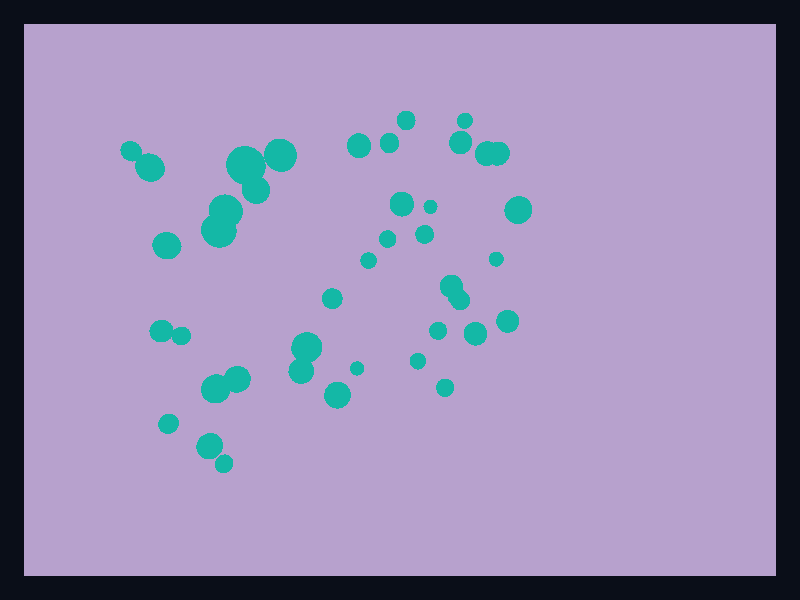
Sparse 3D point cloud uses Fission Charts typed Rust data to render a production-ready 3d and gl view. Use it when individual 3D observations need separation.
Data: Typed chart data, axes, and series.
Use when: Use it when individual 3D observations need separation
Tags: 3d
3D cluster scatter

3D cluster scatter uses Fission Charts typed Rust data to render a production-ready 3d and gl view. Use it for spatial point clusters.
Data: Typed chart data, axes, and series.
Use when: Use it for spatial point clusters
Tags: 3d
3D outlier scatter
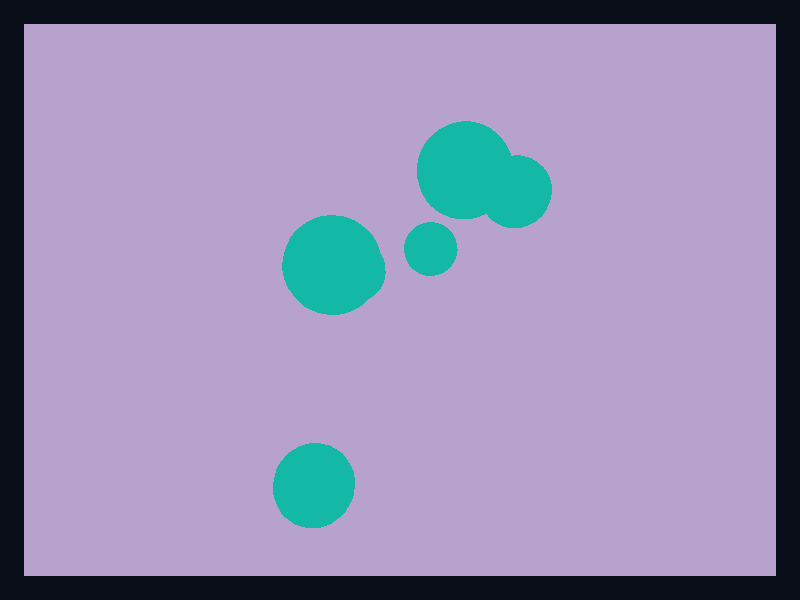
3D outlier scatter uses Fission Charts typed Rust data to render a production-ready 3d and gl view. Use it to show outliers in a point cloud.
Data: Typed chart data, axes, and series.
Use when: Use it to show outliers in a point cloud
Tags: 3d
3D service cloud

3D service cloud uses Fission Charts typed Rust data to render a production-ready 3d and gl view. Use it to visualize clusters of service observations.
Data: Typed chart data, axes, and series.
Use when: Use it to visualize clusters of service observations
Tags: 3d
3D response surface

3D response surface uses Fission Charts typed Rust data to render a production-ready 3d and gl view. Use it for continuous spatial fields.
Data: Typed chart data, axes, and series.
Use when: Use it for continuous spatial fields
Tags: 3d
3D terrain response

3D terrain response uses Fission Charts typed Rust data to render a production-ready 3d and gl view. Use it for elevation and field surfaces.
Data: Typed chart data, axes, and series.
Use when: Use it for elevation and field surfaces
Tags: 3d
3D wave surface

3D wave surface uses Fission Charts typed Rust data to render a production-ready 3d and gl view. Use it for continuous response fields.
Data: Typed chart data, axes, and series.
Use when: Use it for continuous response fields
Tags: 3d
3D risk terrain

3D risk terrain uses Fission Charts typed Rust data to render a production-ready 3d and gl view. Use it for risk and elevation-like surfaces.
Data: Typed chart data, axes, and series.
Use when: Use it for risk and elevation-like surfaces
Tags: 3d
3D topology scene
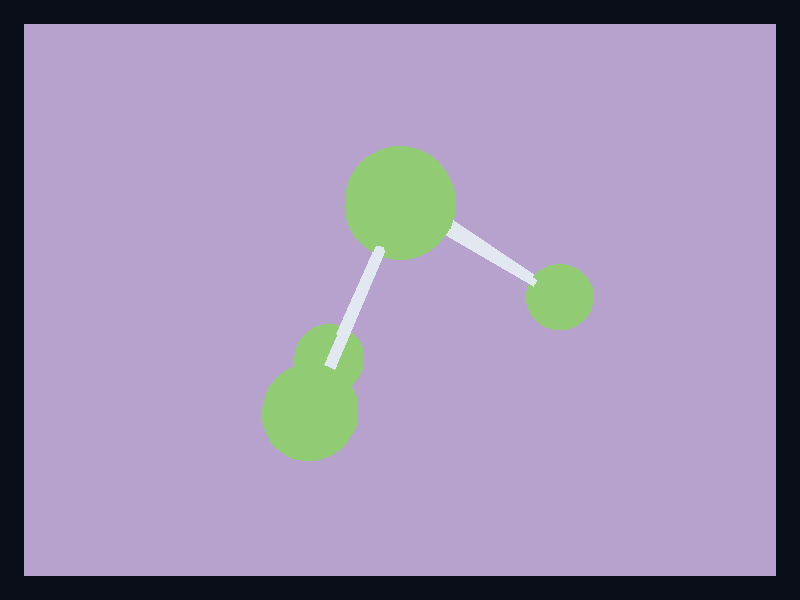
3D topology scene uses Fission Charts typed Rust data to render a production-ready 3d and gl view. Use it when topology benefits from depth.
Data: Typed chart data, axes, and series.
Use when: Use it when topology benefits from depth
Tags: 3d
3D volume points
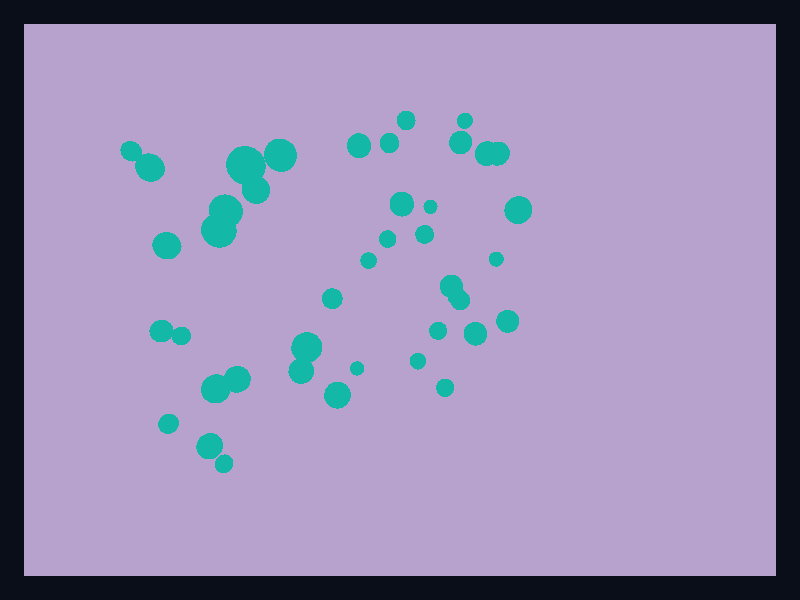
3D volume points uses Fission Charts typed Rust data to render a production-ready 3d and gl view. Use it as the native point-based volume path.
Data: Typed chart data, axes, and series.
Use when: Use it as the native point-based volume path
Tags: 3d
3D surface

A gridded surface lowered into a native 3D mesh. Use it for terrain, response surfaces, and continuous two-variable functions.
Data: Typed chart data, axes, and series.
Use when: Use it for terrain, response surfaces, and continuous two-variable functions
Tags: 3d
3D terrain mesh

Terrain-like green surface mesh. Use it for elevation and terrain fields.
Data: Typed chart data, axes, and series.
Use when: Use it for elevation and terrain fields
Tags: 3d
3D wave surface

Smooth mesh surface. Use it for sampled surfaces.
Data: Typed chart data, axes, and series.
Use when: Use it for sampled surfaces
Tags: 3d
Terrain surface

A raised mesh surface for terrain-like continuous data. Use it for terrain, elevation, and other continuous spatial fields.
Data: Typed chart data, axes, and series.
Use when: Use it for terrain, elevation, and other continuous spatial fields
Tags: 3d
Volume-style point field
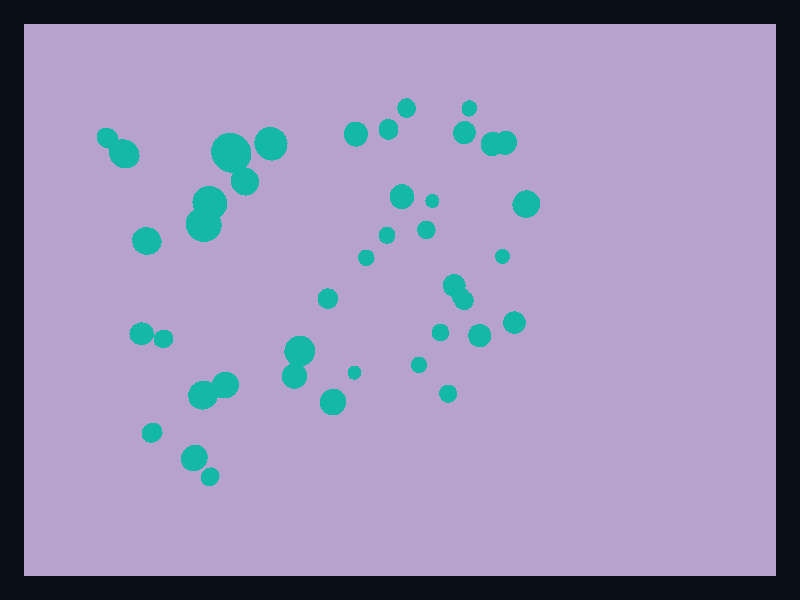
Dense point field suggesting volume data. Use it as the current native path toward volume-style visualization.
Data: Typed chart data, axes, and series.
Use when: Use it as the current native path toward volume-style visualization
Tags: 3d
Analytics
Acquisition trend
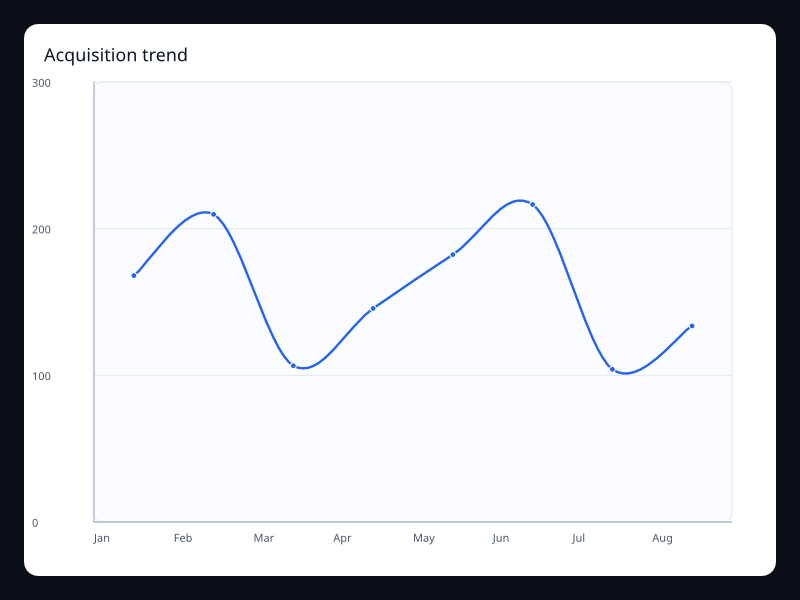
Acquisition trend uses Fission Charts typed Rust data to render a production-ready analytics view. Use it for growth dashboards.
Data: Typed chart data, axes, and series.
Use when: Use it for growth dashboards
Tags: analytics
Engagement calendar
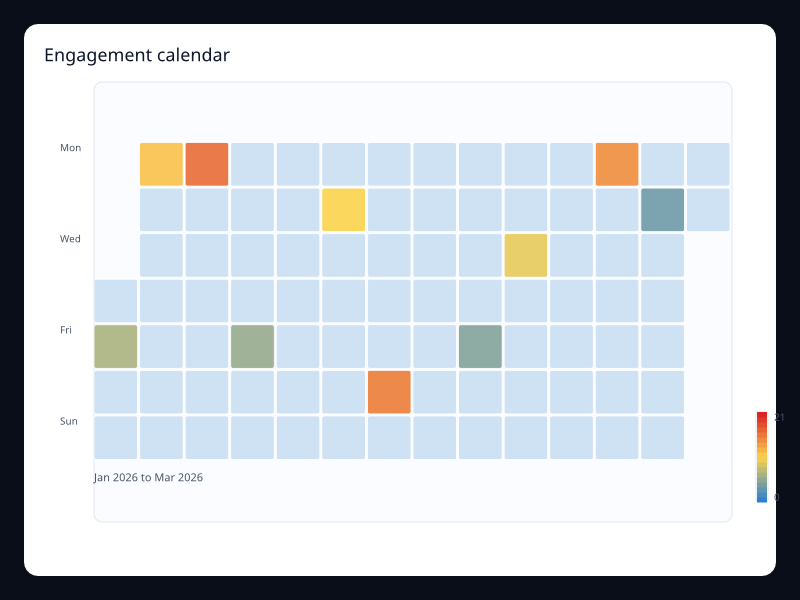
Engagement calendar uses Fission Charts typed Rust data to render a production-ready analytics view. Use it for engagement consistency over time.
Data: Typed chart data, axes, and series.
Use when: Use it for engagement consistency over time
Tags: analytics
Channel stack
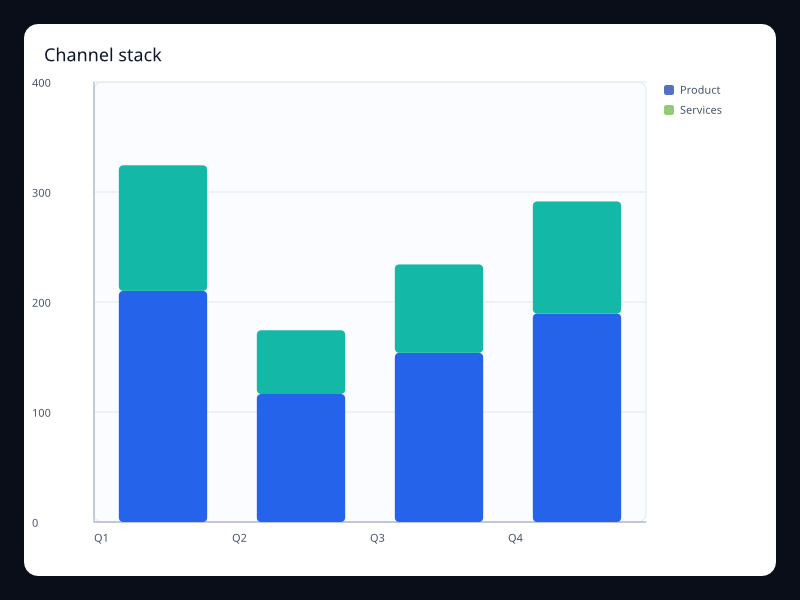
Channel stack uses Fission Charts typed Rust data to render a production-ready analytics view. Use it for acquisition mix.
Data: Typed chart data, axes, and series.
Use when: Use it for acquisition mix
Tags: analytics
Cohort heatmap
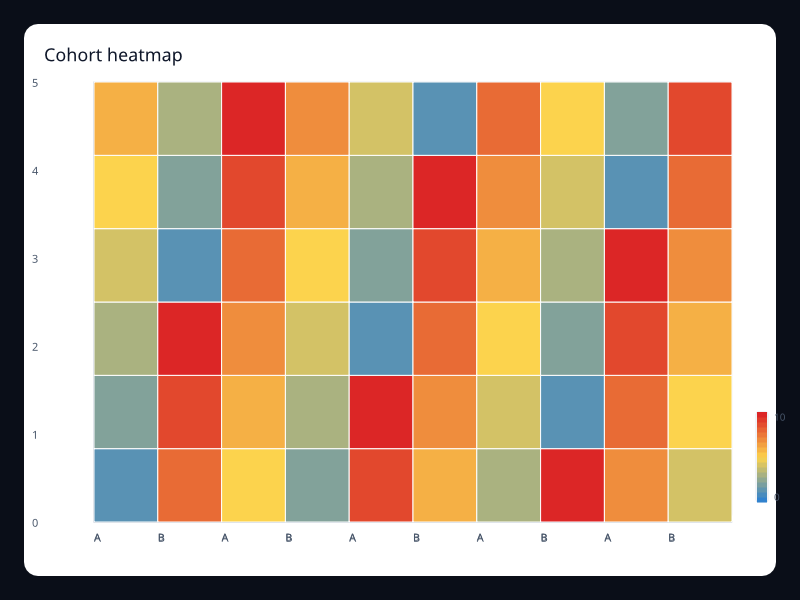
Cohort heatmap uses Fission Charts typed Rust data to render a production-ready analytics view. Use it for retention and cohort intensity.
Data: Typed chart data, axes, and series.
Use when: Use it for retention and cohort intensity
Tags: analytics
Conversion funnel
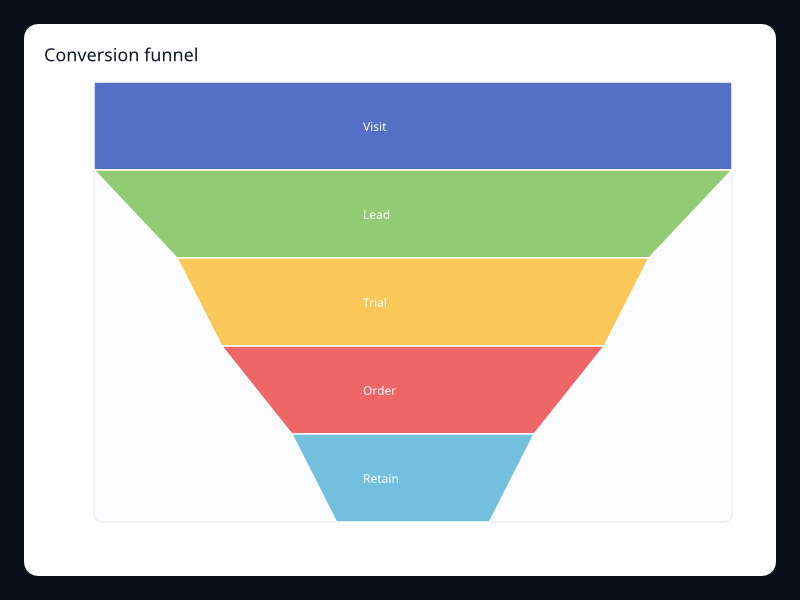
Conversion funnel uses Fission Charts typed Rust data to render a production-ready analytics view. Use it for product funnel analysis.
Data: Typed chart data, axes, and series.
Use when: Use it for product funnel analysis
Tags: analytics
Device mix donut
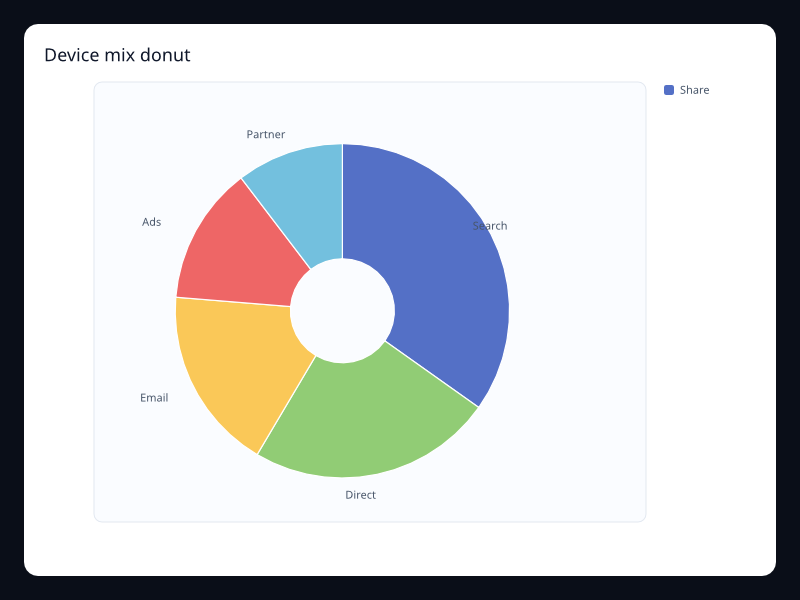
Device mix donut uses Fission Charts typed Rust data to render a production-ready analytics view. Use it when device share matters.
Data: Typed chart data, axes, and series.
Use when: Use it when device share matters
Tags: analytics
Analytics score gauge
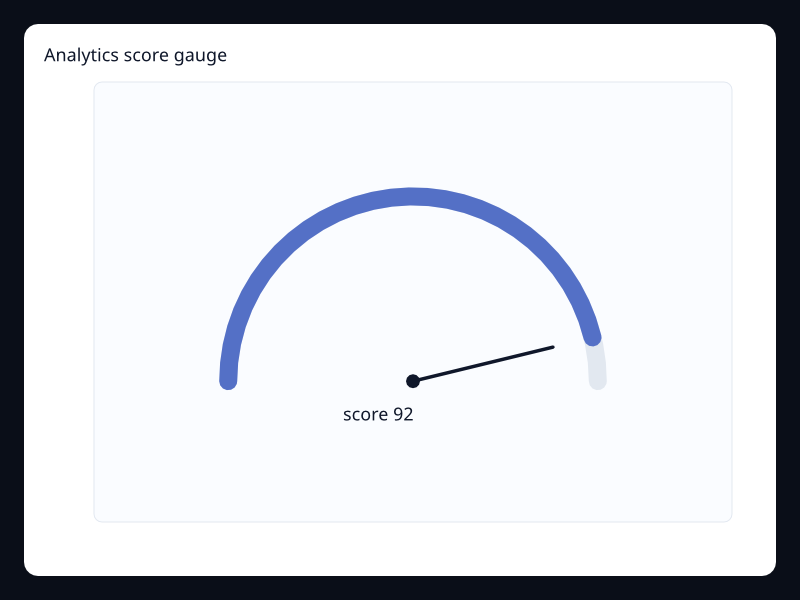
Analytics score gauge uses Fission Charts typed Rust data to render a production-ready analytics view. Use it for primary scorecards.
Data: Typed chart data, axes, and series.
Use when: Use it for primary scorecards
Tags: analytics
Journey graph
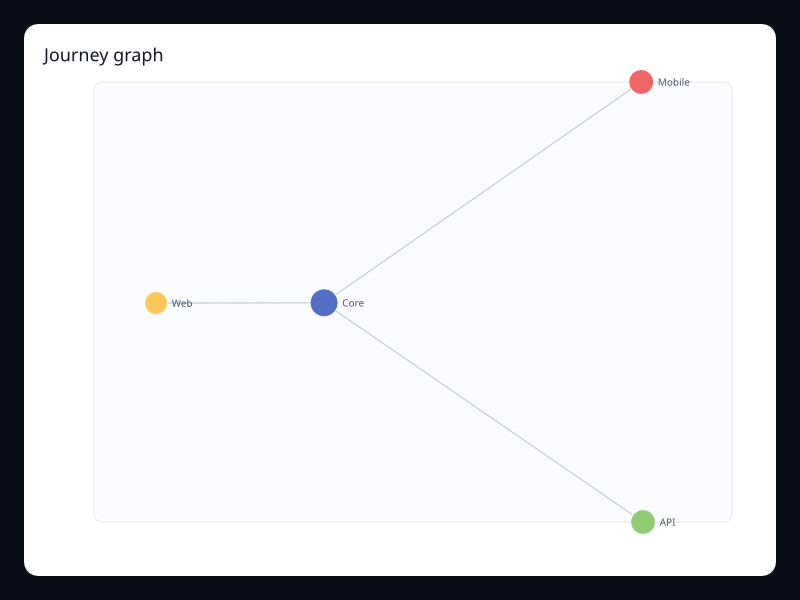
Journey graph uses Fission Charts typed Rust data to render a production-ready analytics view. Use it for relationship-heavy behavior views.
Data: Typed chart data, axes, and series.
Use when: Use it for relationship-heavy behavior views
Tags: analytics
Journey sankey
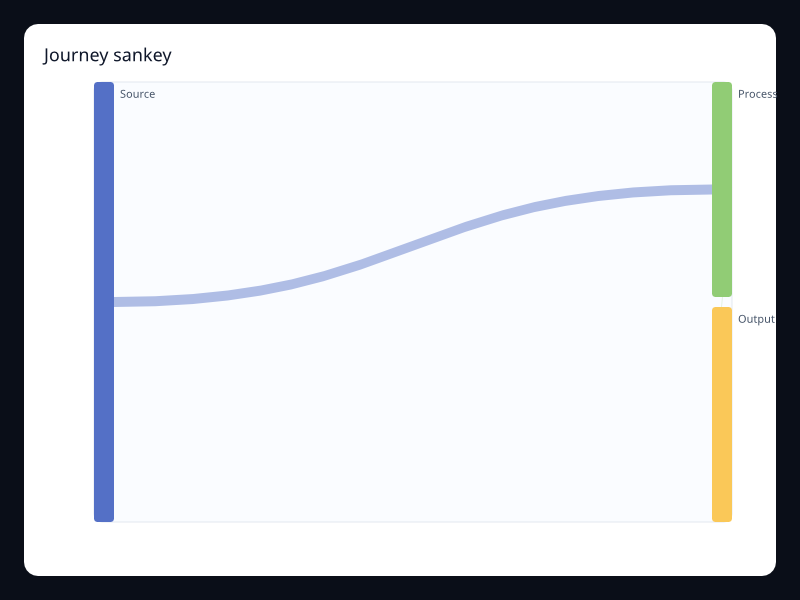
Journey sankey uses Fission Charts typed Rust data to render a production-ready analytics view. Use it for user movement between stages.
Data: Typed chart data, axes, and series.
Use when: Use it for user movement between stages
Tags: analytics
Market share pie
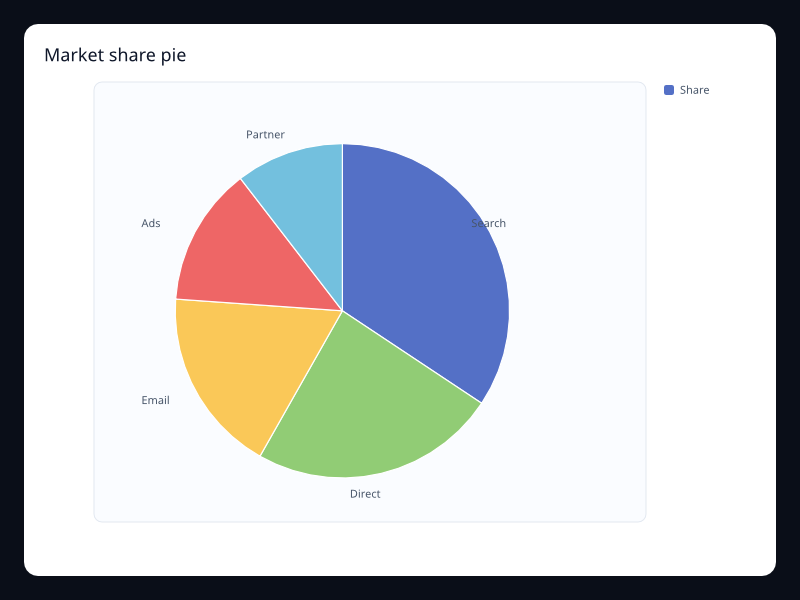
Market share pie uses Fission Charts typed Rust data to render a production-ready analytics view. Use it for small whole comparisons.
Data: Typed chart data, axes, and series.
Use when: Use it for small whole comparisons
Tags: analytics
Segment parallel
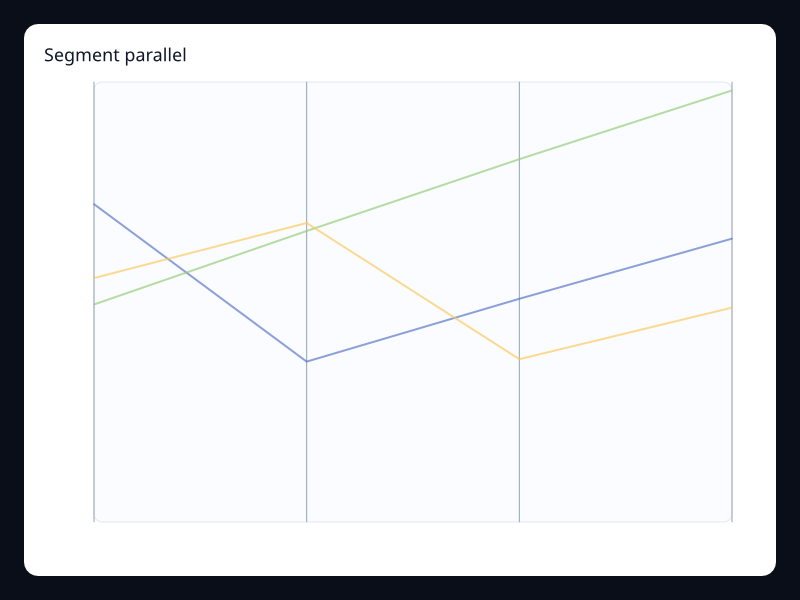
Segment parallel uses Fission Charts typed Rust data to render a production-ready analytics view. Use it for segment tradeoff analysis.
Data: Typed chart data, axes, and series.
Use when: Use it for segment tradeoff analysis
Tags: analytics
Product radar
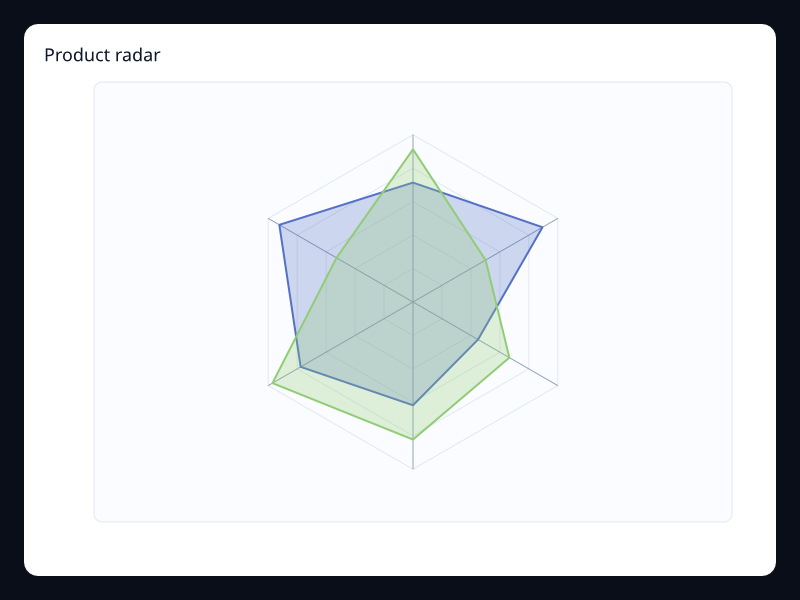
Product radar uses Fission Charts typed Rust data to render a production-ready analytics view. Use it to compare product health dimensions.
Data: Typed chart data, axes, and series.
Use when: Use it to compare product health dimensions
Tags: analytics
Region sales map
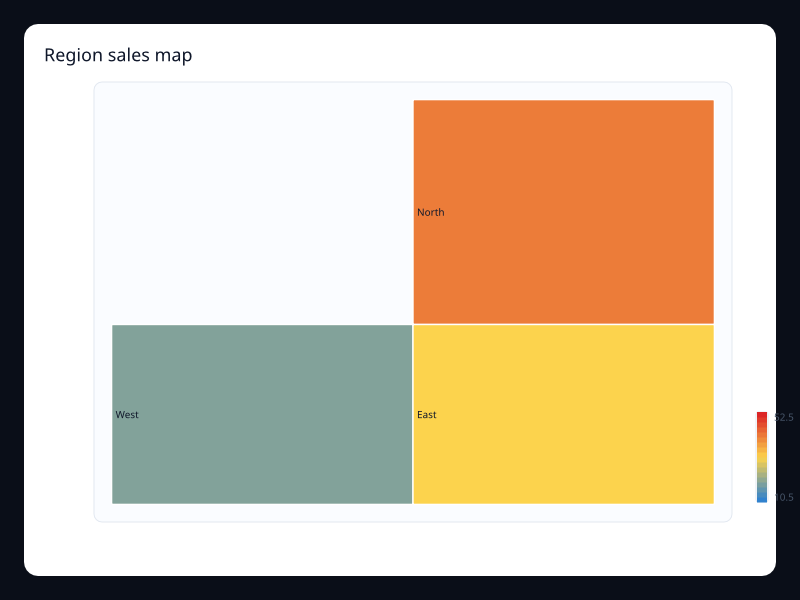
Region sales map uses Fission Charts typed Rust data to render a production-ready analytics view. Use it for geographic sales analysis.
Data: Typed chart data, axes, and series.
Use when: Use it for geographic sales analysis
Tags: analytics
Retention area
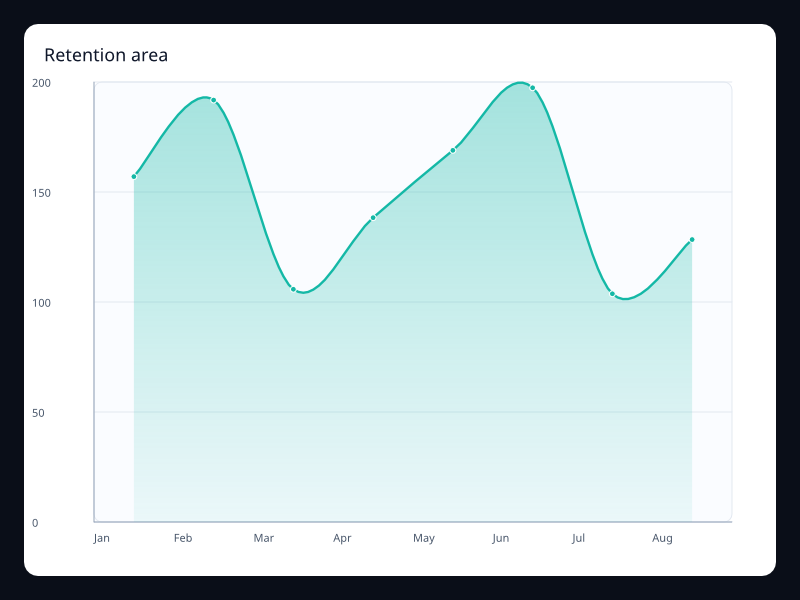
Retention area uses Fission Charts typed Rust data to render a production-ready analytics view. Use it when volume and trend both matter.
Data: Typed chart data, axes, and series.
Use when: Use it when volume and trend both matter
Tags: analytics
Engagement routes
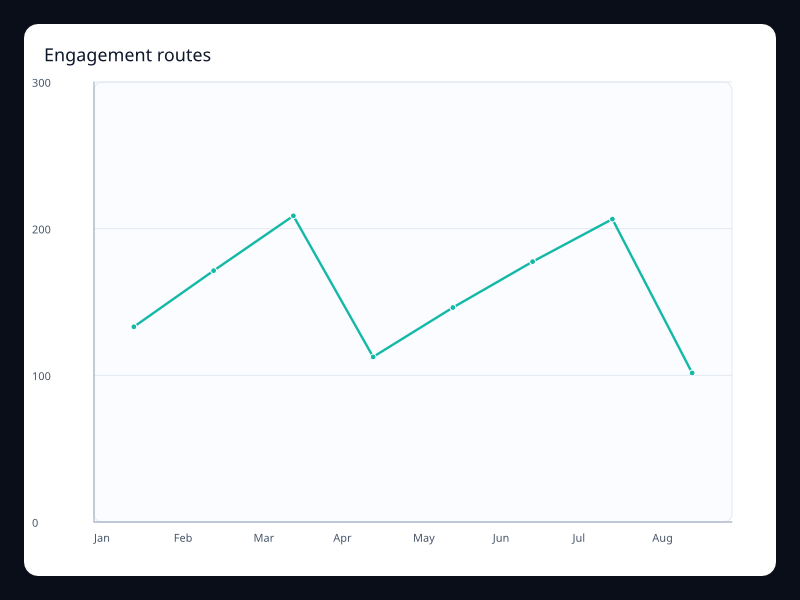
Engagement routes uses Fission Charts typed Rust data to render a production-ready analytics view. Use it for spatial engagement flows.
Data: Typed chart data, axes, and series.
Use when: Use it for spatial engagement flows
Tags: analytics
Segment bubbles
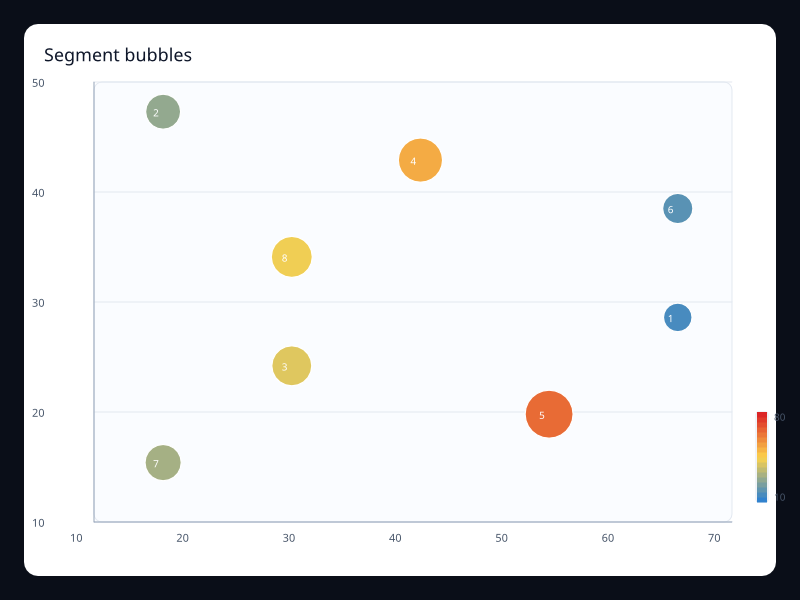
Segment bubbles uses Fission Charts typed Rust data to render a production-ready analytics view. Use it for multidimensional segment comparison.
Data: Typed chart data, axes, and series.
Use when: Use it for multidimensional segment comparison
Tags: analytics
Source theme river
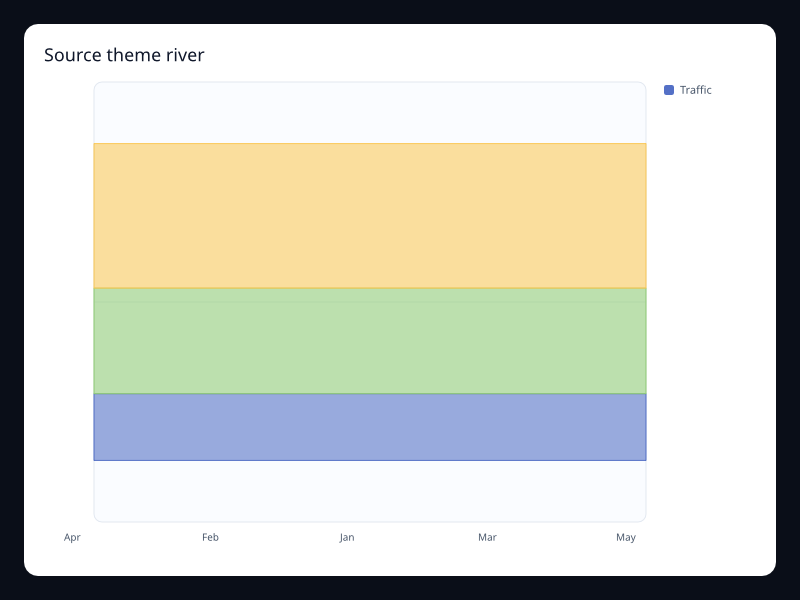
Source theme river uses Fission Charts typed Rust data to render a production-ready analytics view. Use it for changing source composition.
Data: Typed chart data, axes, and series.
Use when: Use it for changing source composition
Tags: analytics
Portfolio sunburst
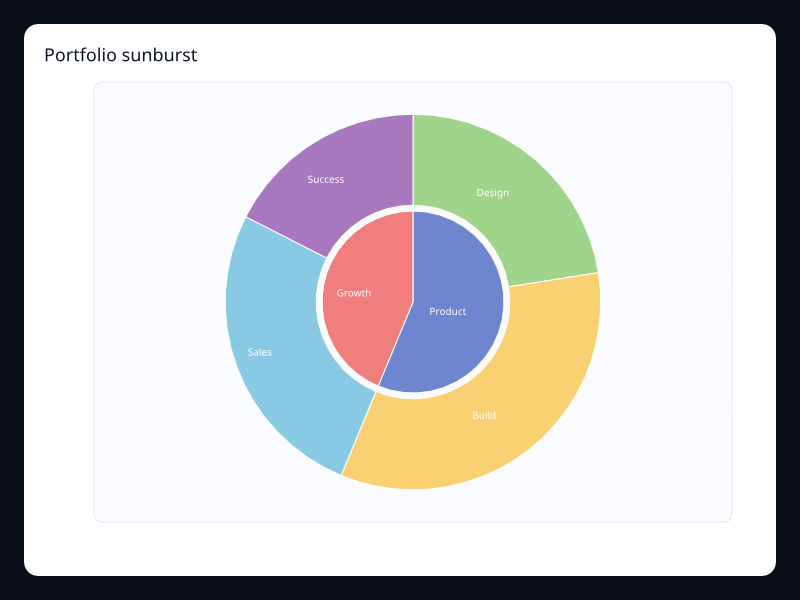
Portfolio sunburst uses Fission Charts typed Rust data to render a production-ready analytics view. Use it for hierarchical portfolio composition.
Data: Typed chart data, axes, and series.
Use when: Use it for hierarchical portfolio composition
Tags: analytics
Report toolbox chart
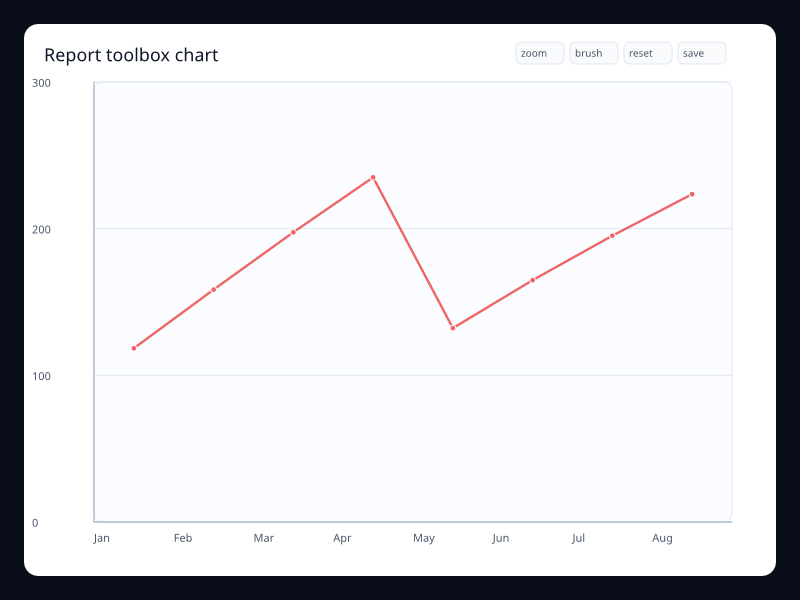
Report toolbox chart uses Fission Charts typed Rust data to render a production-ready analytics view. Use it when analytics views need built-in controls.
Data: Typed chart data, axes, and series.
Use when: Use it when analytics views need built-in controls
Tags: analytics
Feature treemap
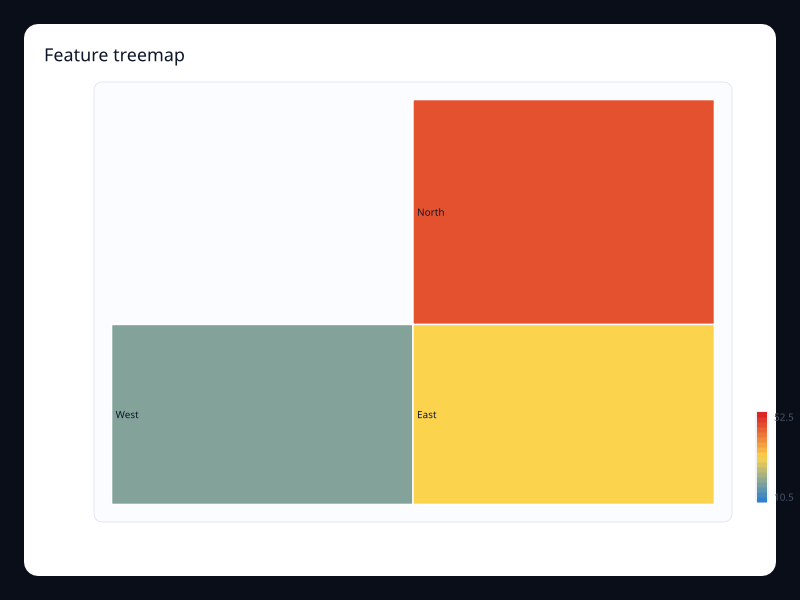
Feature treemap uses Fission Charts typed Rust data to render a production-ready analytics view. Use it for feature usage share.
Data: Typed chart data, axes, and series.
Use when: Use it for feature usage share
Tags: analytics
Bar
Benchmark comparison
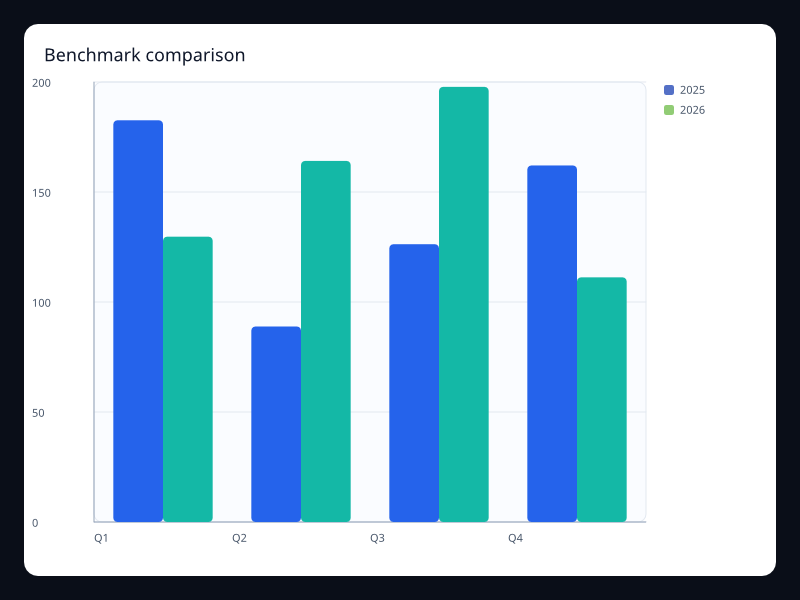
Benchmark comparison uses Fission Charts typed Rust data to render a production-ready bar view. Use it when each category needs a direct benchmark.
Data: Typed chart data, axes, and series.
Use when: Use it when each category needs a direct benchmark
Tags: bar
Budget stack
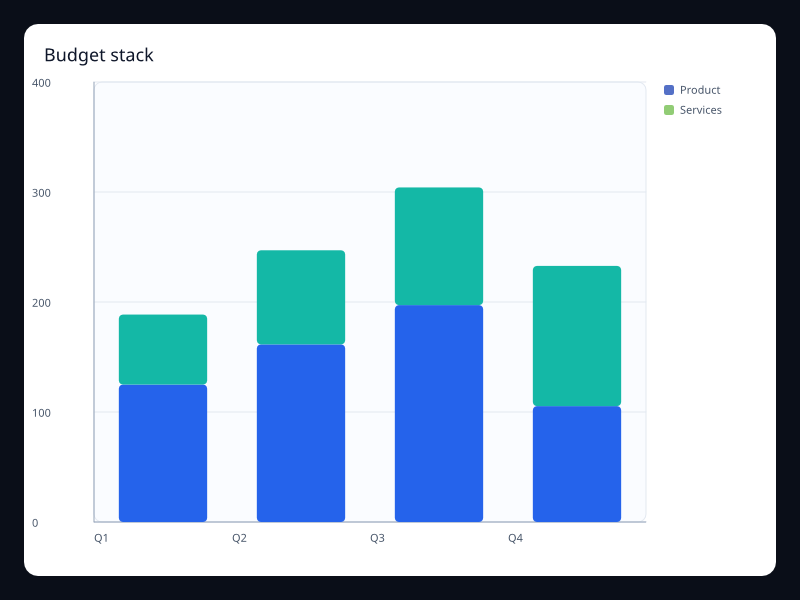
Stacked bars for budget contribution by department. Use it for departmental totals and breakdowns.
Data: Typed chart data, axes, and series.
Use when: Use it for departmental totals and breakdowns
Tags: bar
Budget variance
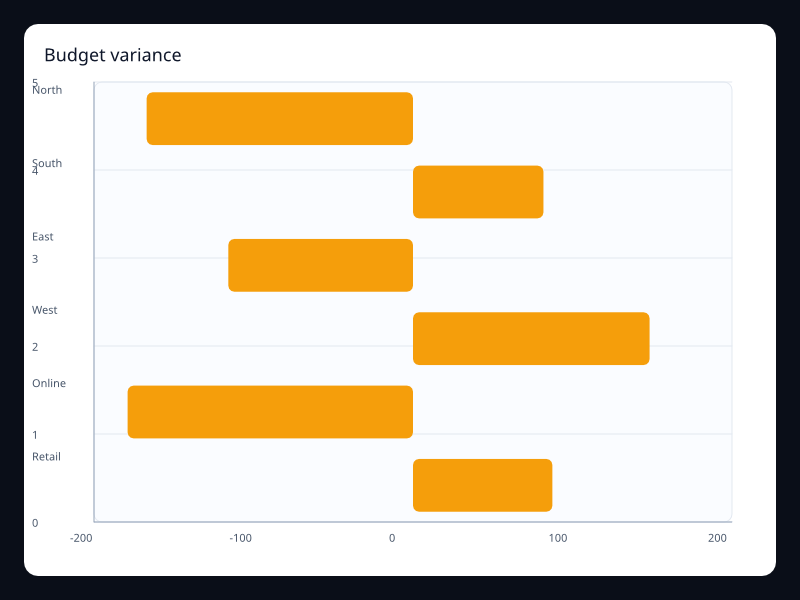
Budget variance uses Fission Charts typed Rust data to render a production-ready bar view. Use it when over and under budget must be symmetric.
Data: Typed chart data, axes, and series.
Use when: Use it when over and under budget must be symmetric
Tags: bar
Capacity bars
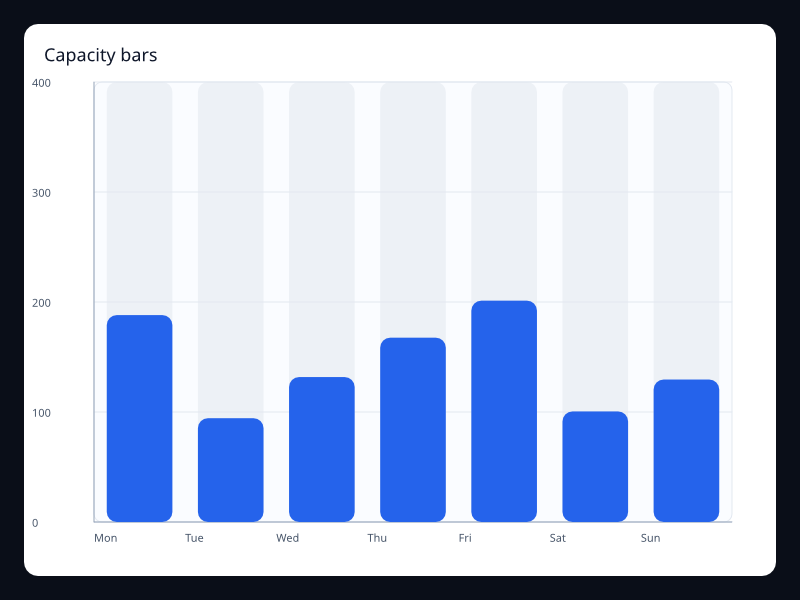
Bars drawn inside visible capacity tracks. Use it for quota and inventory screens.
Data: Typed chart data, axes, and series.
Use when: Use it for quota and inventory screens
Tags: bar
Channel stack
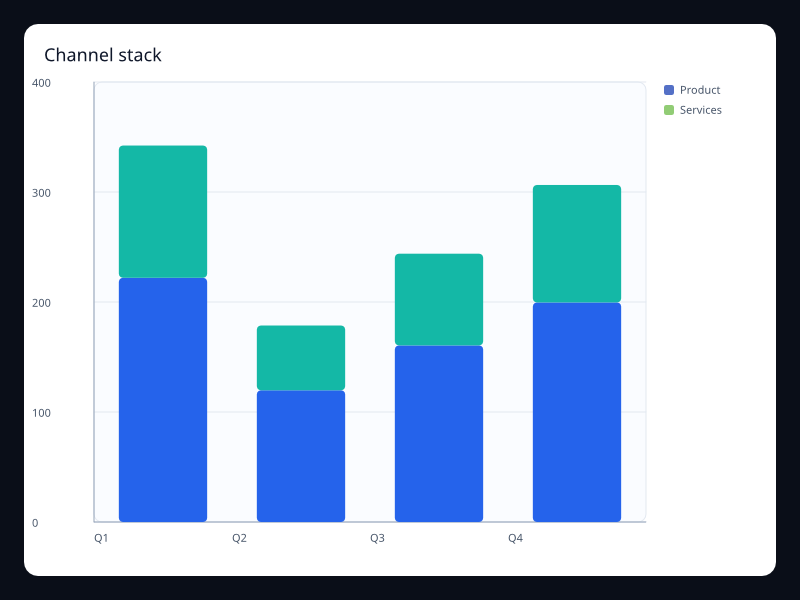
Channel stack uses Fission Charts typed Rust data to render a production-ready bar view. Use it when total and contribution both matter.
Data: Typed chart data, axes, and series.
Use when: Use it when total and contribution both matter
Tags: bar
Compact category bars
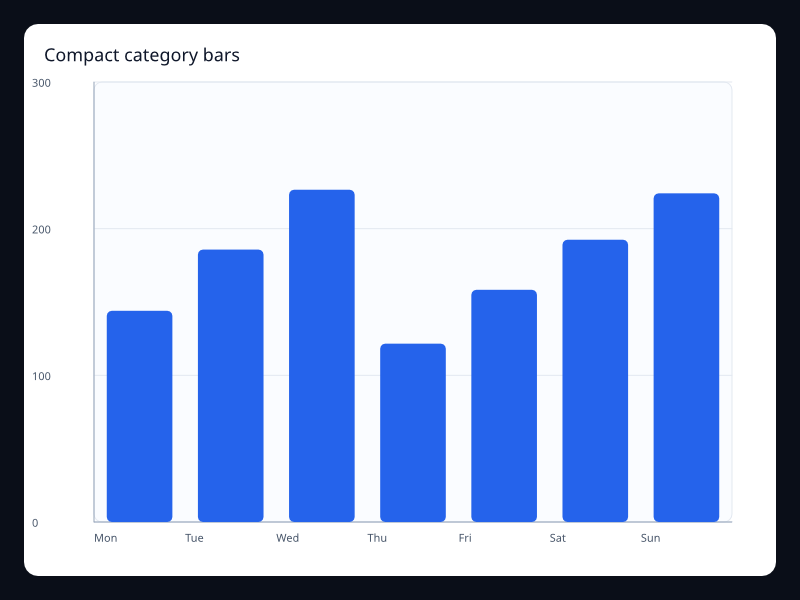
Small category comparison with a clean vertical bar layout. Use it for short lists and cards.
Data: Typed chart data, axes, and series.
Use when: Use it for short lists and cards
Tags: bar
Customer segment bars
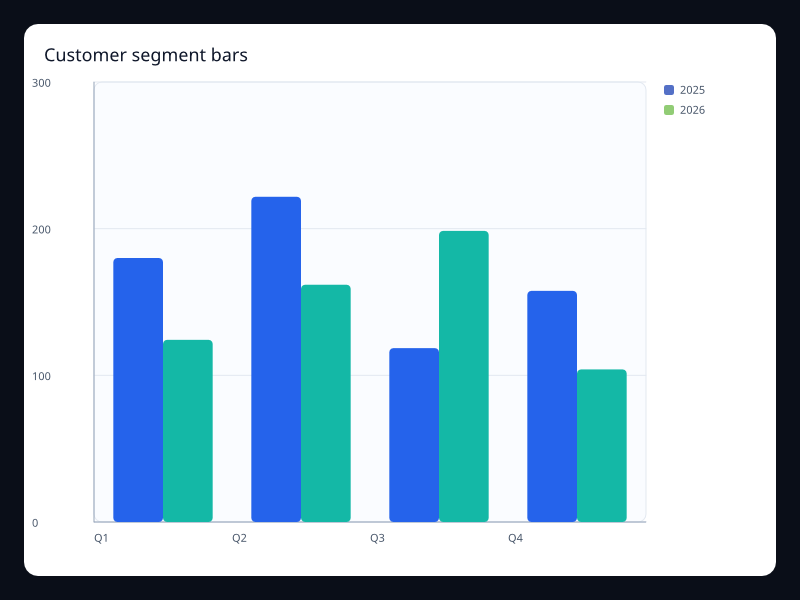
Customer segment bars uses Fission Charts typed Rust data to render a production-ready bar view. Use it to compare segments without splitting the page.
Data: Typed chart data, axes, and series.
Use when: Use it to compare segments without splitting the page
Tags: bar
Diverging bar
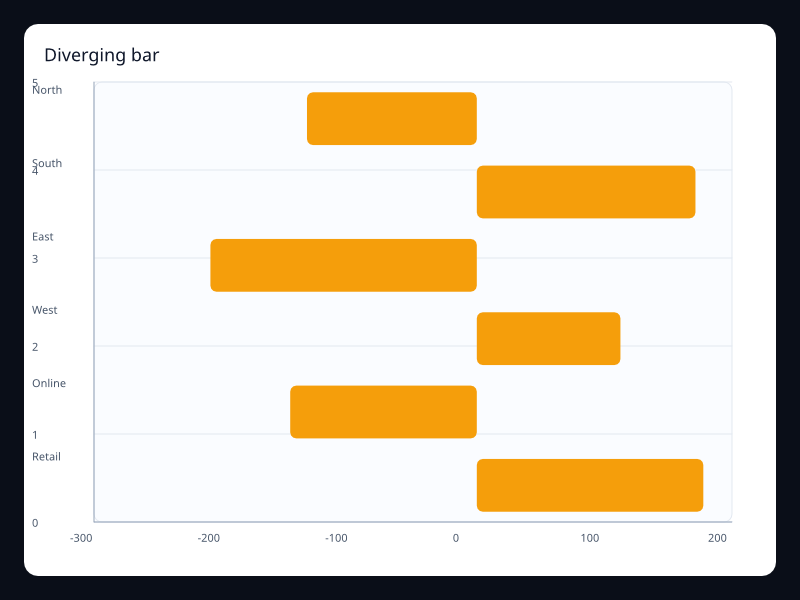
Horizontal bars extending in both directions from zero. Use it for sentiment, deltas, and balance views.
Data: Typed chart data, axes, and series.
Use when: Use it for sentiment, deltas, and balance views
Tags: bar
Funnel unit pictorial bars
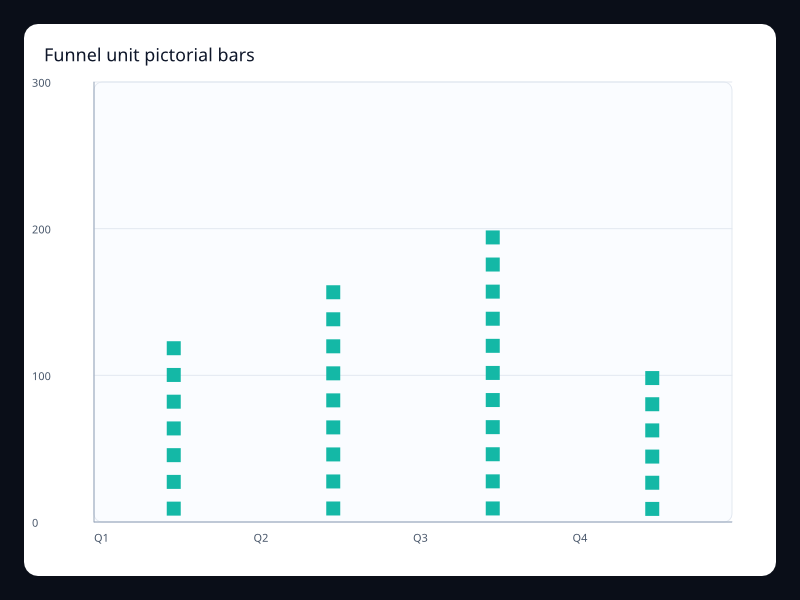
Funnel unit pictorial bars uses Fission Charts typed Rust data to render a production-ready bar view. Use it when unit counts should feel more tactile than rectangles.
Data: Typed chart data, axes, and series.
Use when: Use it when unit counts should feel more tactile than rectangles
Tags: bar
Grouped quarterly bars
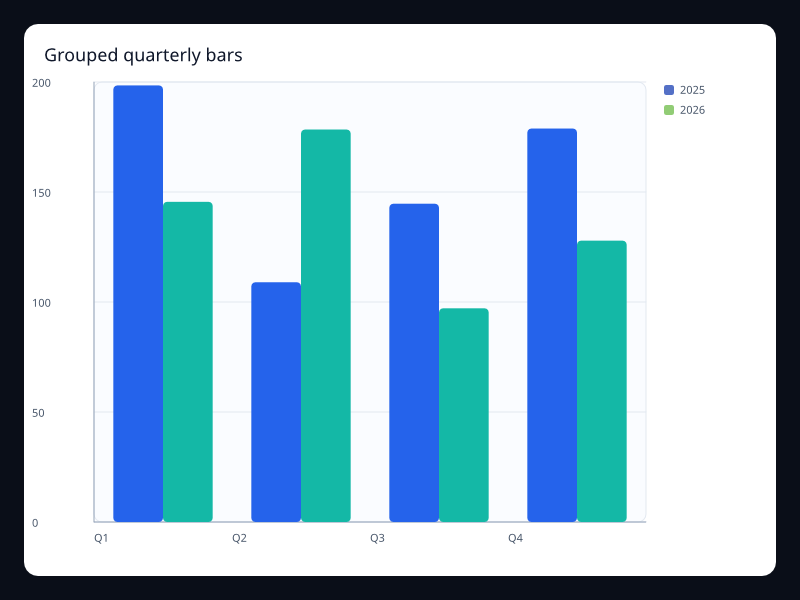
Grouped bars comparing several periods per category. Use it for side-by-side period comparisons.
Data: Typed chart data, axes, and series.
Use when: Use it for side-by-side period comparisons
Tags: bar
KPI background bars
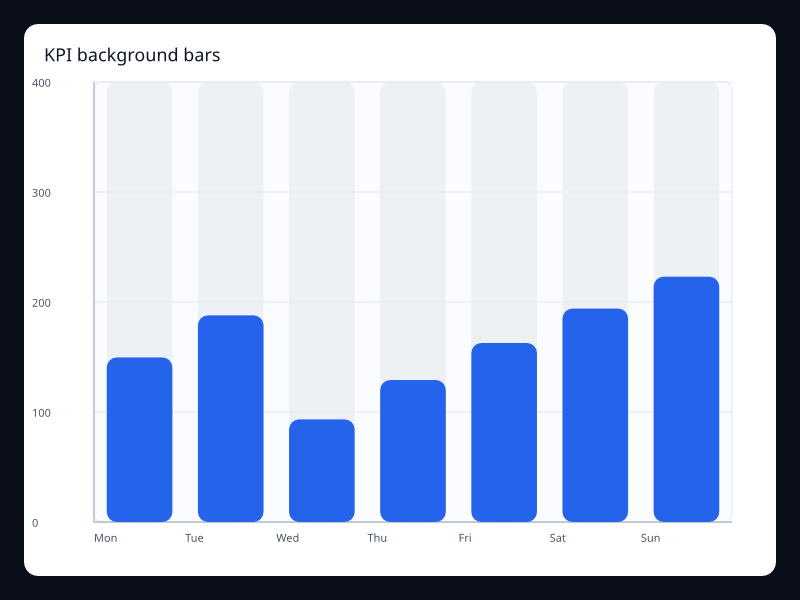
KPI bars with background tracks. Use it for KPI completion panels.
Data: Typed chart data, axes, and series.
Use when: Use it for KPI completion panels
Tags: bar
Negative delta bars
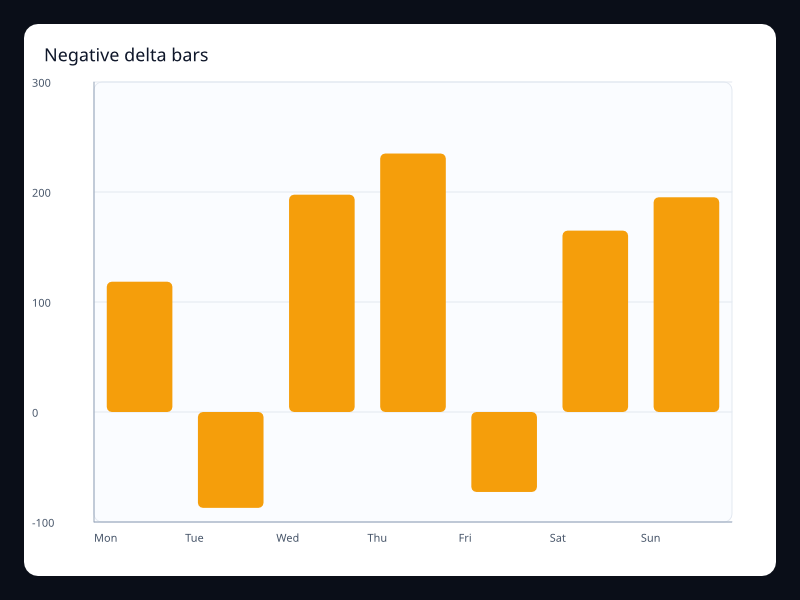
Vertical bars with positive and negative changes. Use it for variance and profit/loss dashboards.
Data: Typed chart data, axes, and series.
Use when: Use it for variance and profit/loss dashboards
Tags: bar
Performance bands
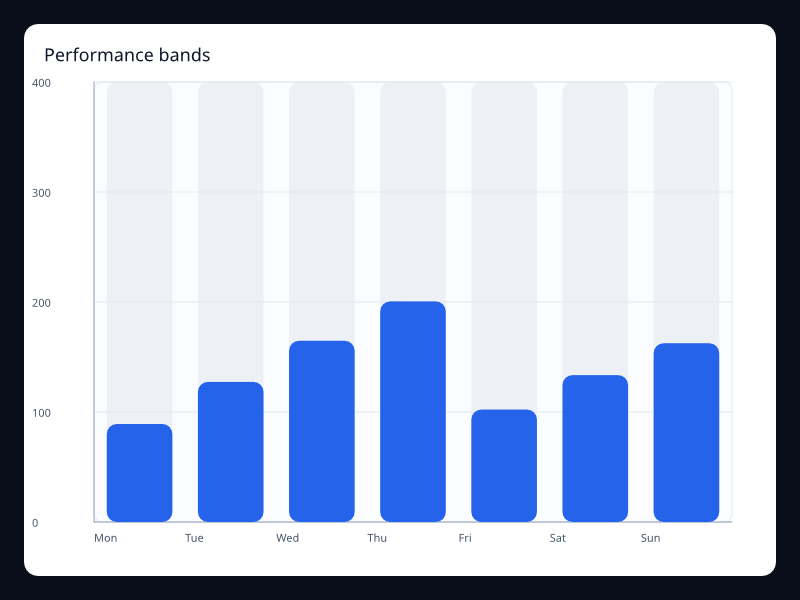
Performance bands uses Fission Charts typed Rust data to render a production-ready bar view. Use it for scorecards where progress is the dominant signal.
Data: Typed chart data, axes, and series.
Use when: Use it for scorecards where progress is the dominant signal
Tags: bar
Pictorial units
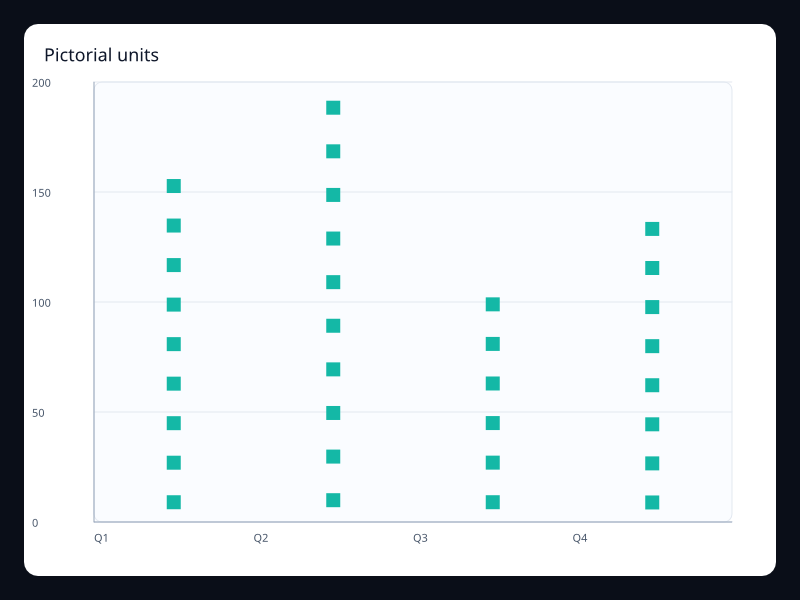
Repeated symbols representing category values. Use it for branded but still quantitative category displays.
Data: Typed chart data, axes, and series.
Use when: Use it for branded but still quantitative category displays
Tags: bar
Priority queue bars
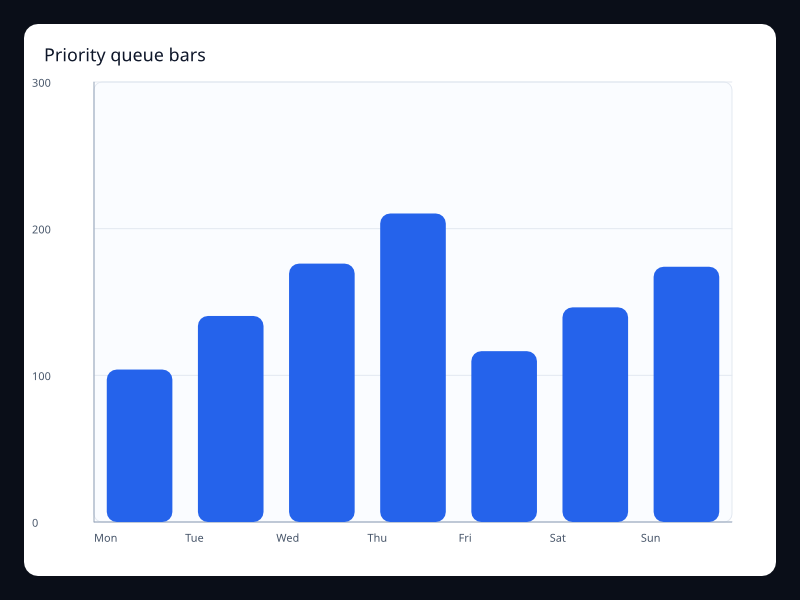
Priority queue bars uses Fission Charts typed Rust data to render a production-ready bar view. Use it when bars sit inside a polished app surface.
Data: Typed chart data, axes, and series.
Use when: Use it when bars sit inside a polished app surface
Tags: bar
Product stack bars
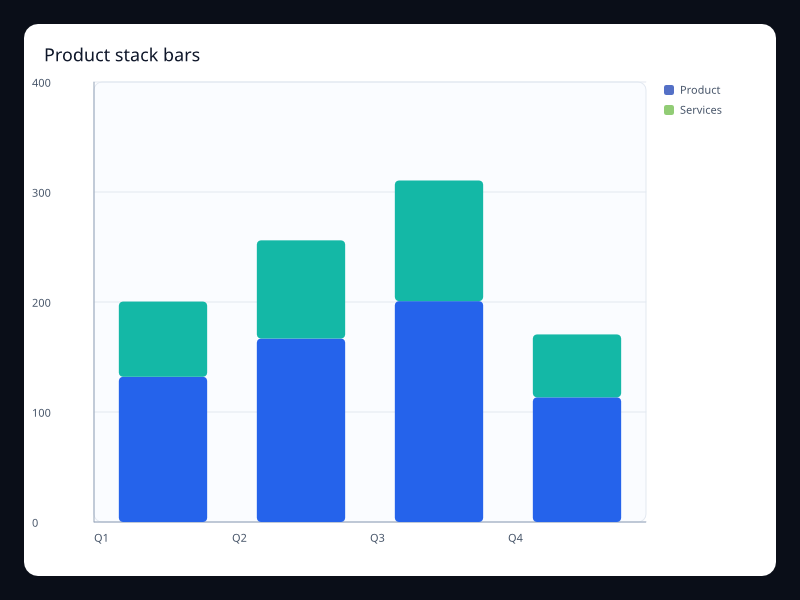
Product stack bars uses Fission Charts typed Rust data to render a production-ready bar view. Use it for portfolio composition.
Data: Typed chart data, axes, and series.
Use when: Use it for portfolio composition
Tags: bar
Profit and loss bars
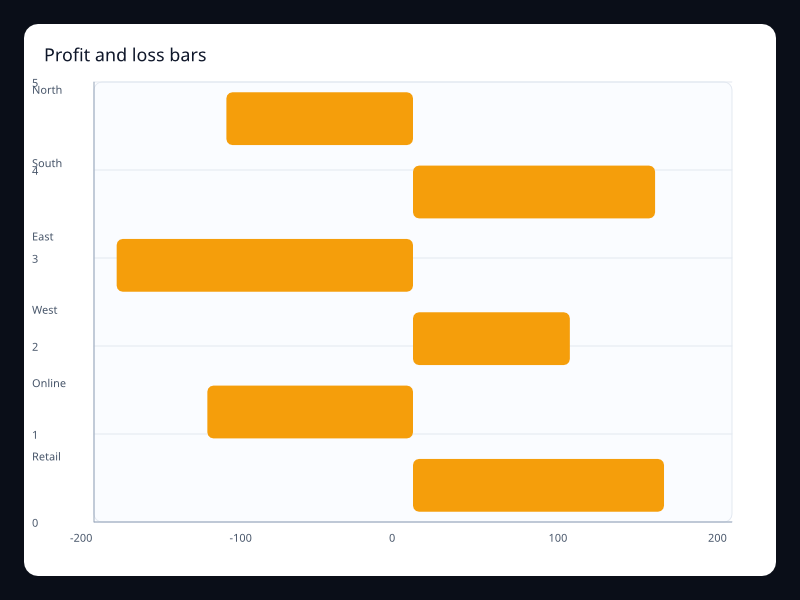
Profit and loss bars uses Fission Charts typed Rust data to render a production-ready bar view. Use it when gains and losses must share one baseline.
Data: Typed chart data, axes, and series.
Use when: Use it when gains and losses must share one baseline
Tags: bar
Quarter waterfall
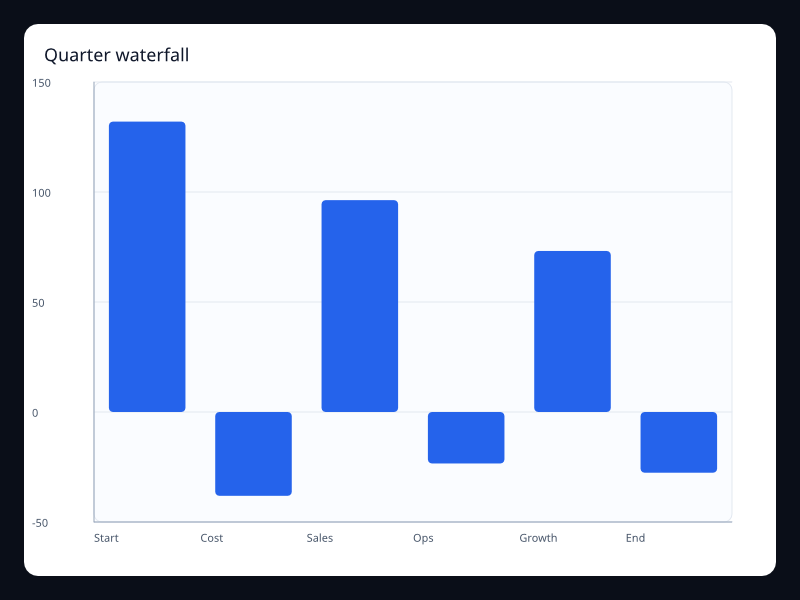
Quarter waterfall uses Fission Charts typed Rust data to render a production-ready bar view. Use it for financial bridge and variance analysis.
Data: Typed chart data, axes, and series.
Use when: Use it for financial bridge and variance analysis
Tags: bar
Ranked bar
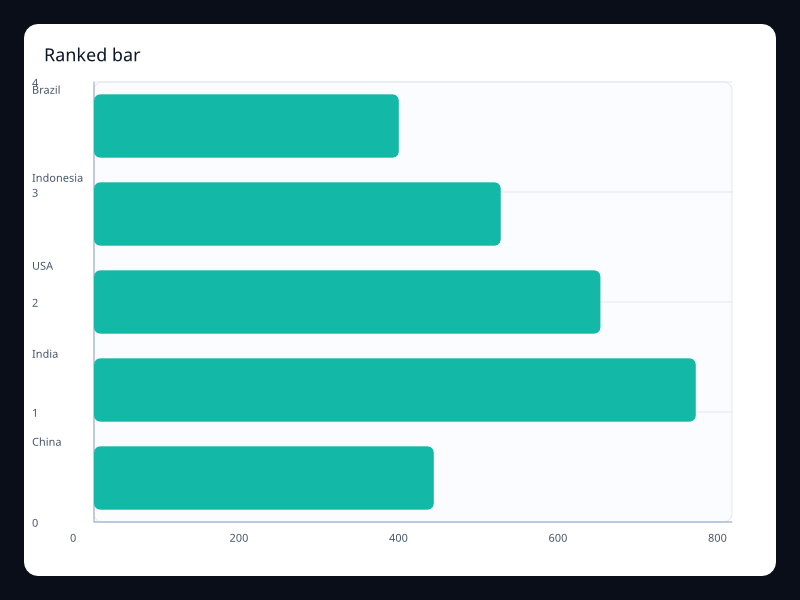
Horizontal bars sorted by value. Use it for rankings with long labels.
Data: Typed chart data, axes, and series.
Use when: Use it for rankings with long labels
Tags: bar
Region comparison bars
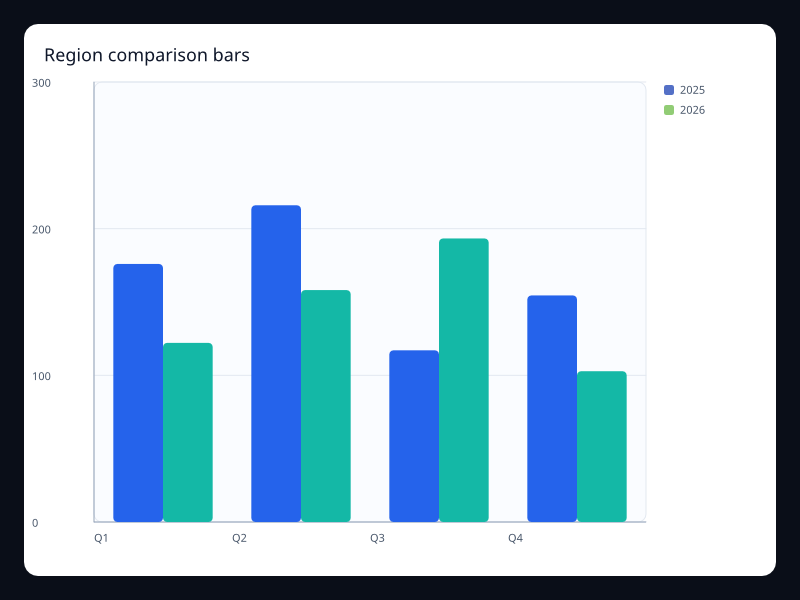
Grouped regional values over shared categories. Use it for region-by-period comparisons.
Data: Typed chart data, axes, and series.
Use when: Use it for region-by-period comparisons
Tags: bar
Region ranking
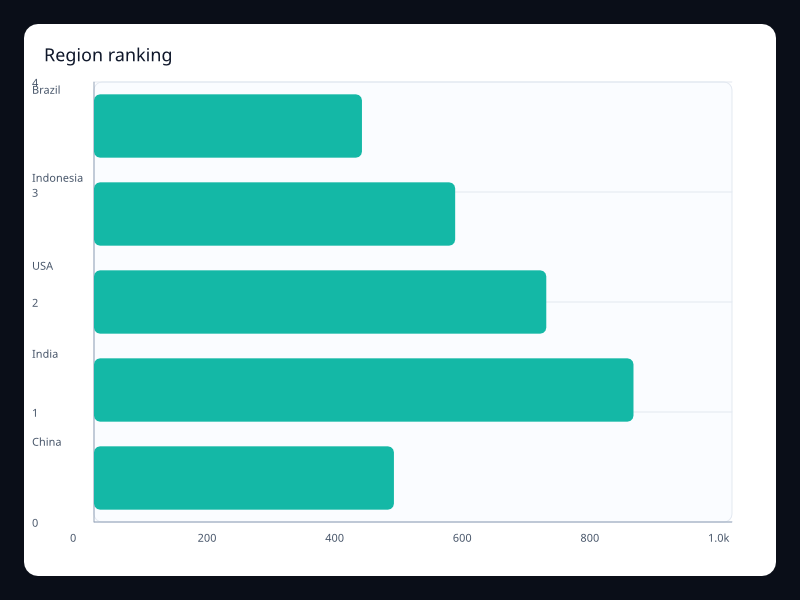
Region ranking uses Fission Charts typed Rust data to render a production-ready bar view. Use it when exact rank is the product question.
Data: Typed chart data, axes, and series.
Use when: Use it when exact rank is the product question
Tags: bar
Retail waterfall
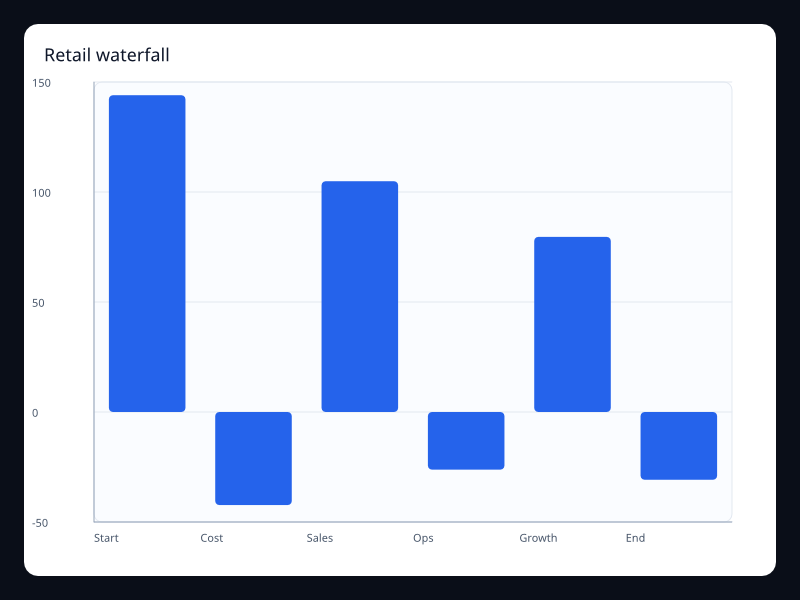
Retail waterfall uses Fission Charts typed Rust data to render a production-ready bar view. Use it for retail contribution analysis.
Data: Typed chart data, axes, and series.
Use when: Use it for retail contribution analysis
Tags: bar
Return deltas
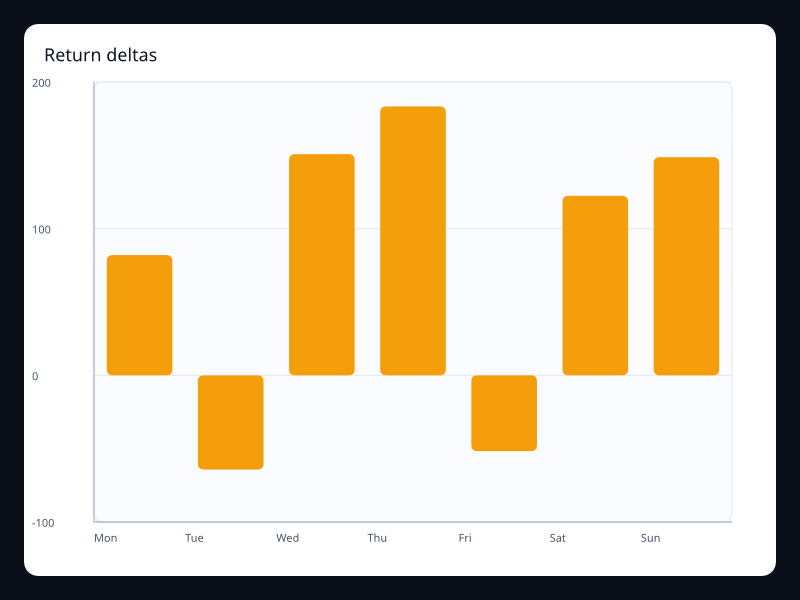
Return deltas uses Fission Charts typed Rust data to render a production-ready bar view. Use it for change analysis around zero.
Data: Typed chart data, axes, and series.
Use when: Use it for change analysis around zero
Tags: bar
Rounded bar
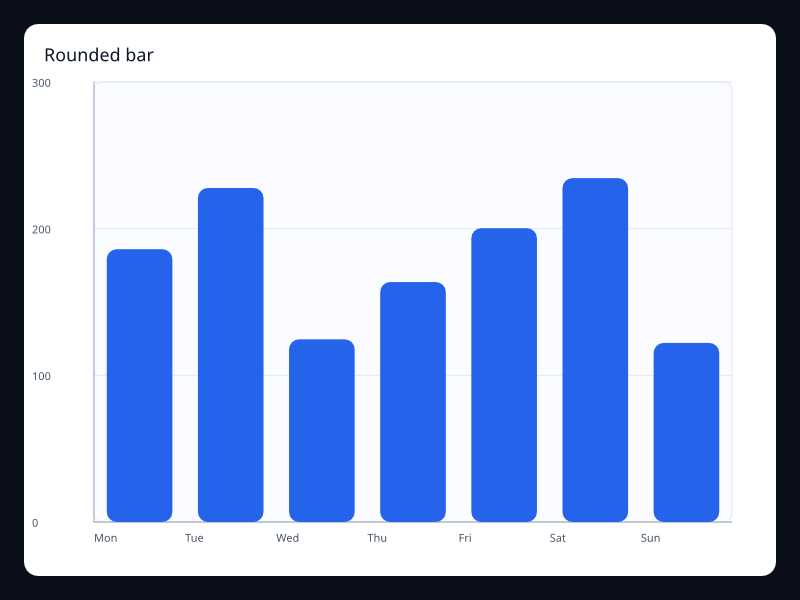
Bars with rounded corners for dashboard presentation. Use it when the chart sits in a polished product dashboard.
Data: Typed chart data, axes, and series.
Use when: Use it when the chart sits in a polished product dashboard
Tags: bar
Sales target track
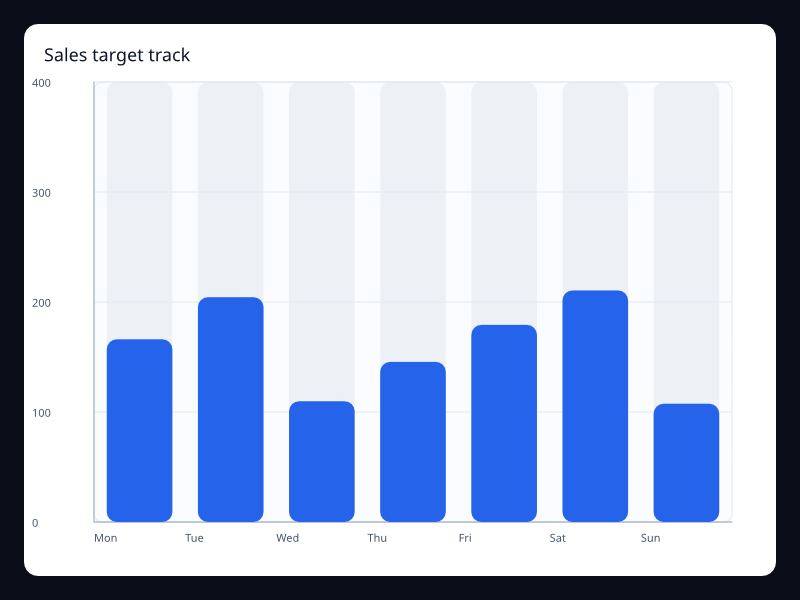
Sales target track uses Fission Charts typed Rust data to render a production-ready bar view. Use it when completion against capacity is more important than raw count.
Data: Typed chart data, axes, and series.
Use when: Use it when completion against capacity is more important than raw count
Tags: bar
SLA breach delta
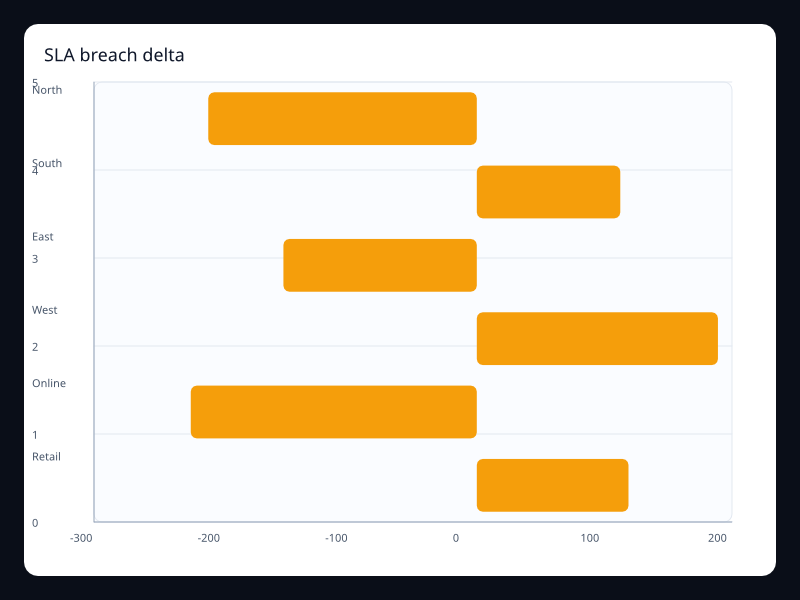
SLA breach delta uses Fission Charts typed Rust data to render a production-ready bar view. Use it for operational exception reporting.
Data: Typed chart data, axes, and series.
Use when: Use it for operational exception reporting
Tags: bar
Small multiple bars A
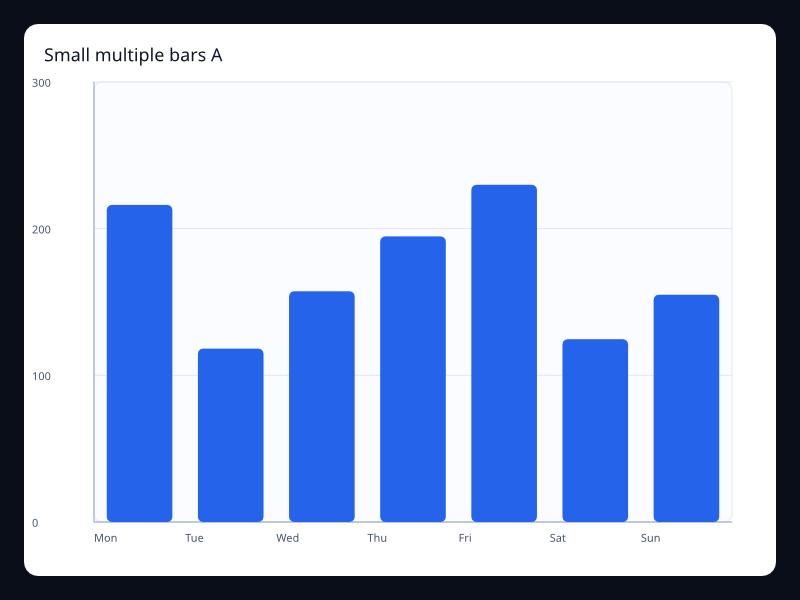
A focused bar chart variant for compact dashboards. Use it in repeated dashboard cards.
Data: Typed chart data, axes, and series.
Use when: Use it in repeated dashboard cards
Tags: bar
Small multiple bars B
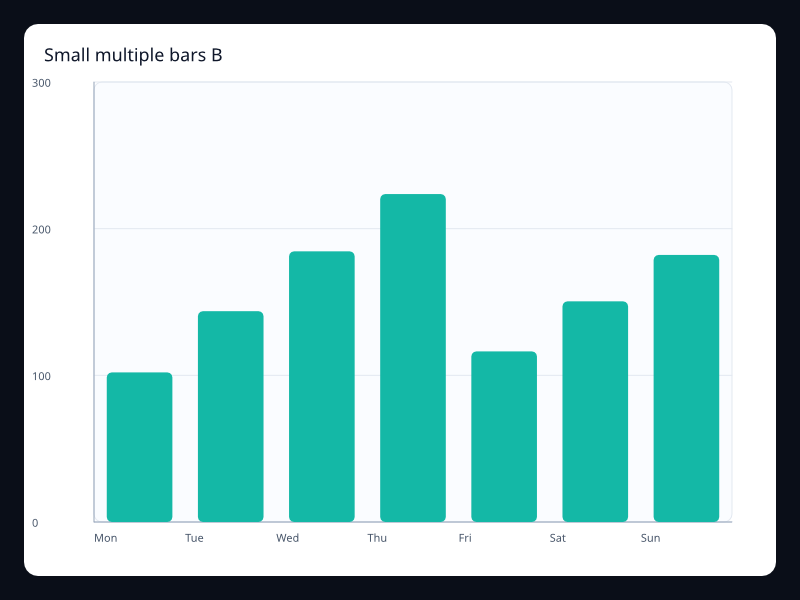
A second compact bar chart with different distribution. Use it when multiple products use the same visual scale.
Data: Typed chart data, axes, and series.
Use when: Use it when multiple products use the same visual scale
Tags: bar
Sorted horizontal bars
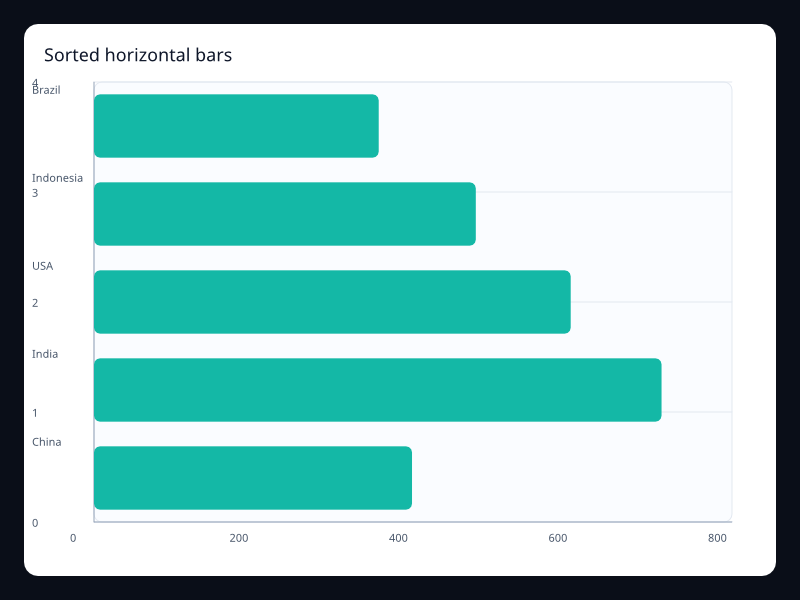
Horizontal ranking sorted largest to smallest. Use it for top-N views.
Data: Typed chart data, axes, and series.
Use when: Use it for top-N views
Tags: bar
Stacked revenue bars
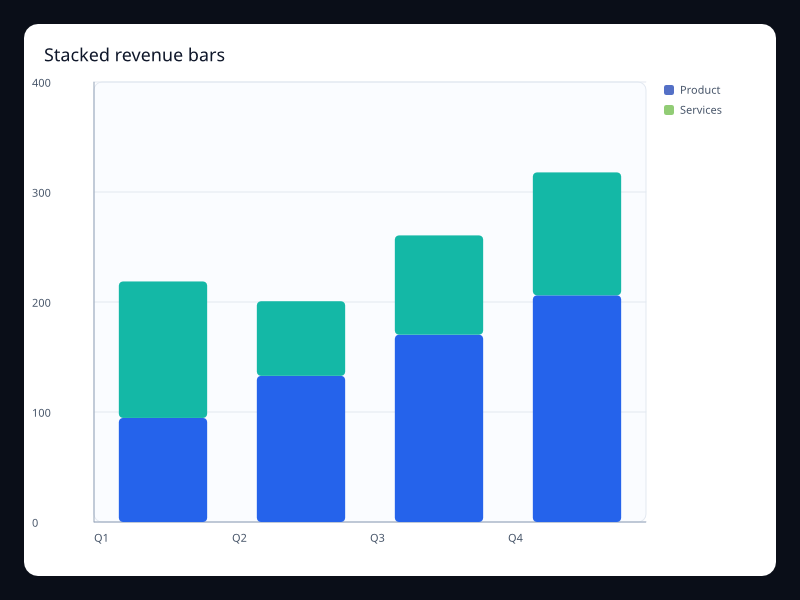
Stacked bars showing total and contribution. Use it when totals and composition matter together.
Data: Typed chart data, axes, and series.
Use when: Use it when totals and composition matter together
Tags: bar
Store comparison
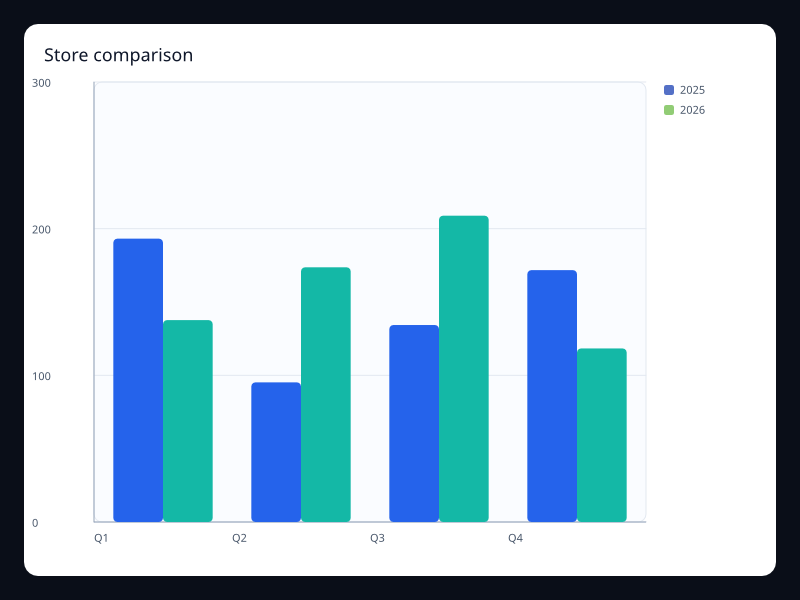
Store comparison uses Fission Charts typed Rust data to render a production-ready bar view. Use it to compare periods inside each category.
Data: Typed chart data, axes, and series.
Use when: Use it to compare periods inside each category
Tags: bar
Team load bars
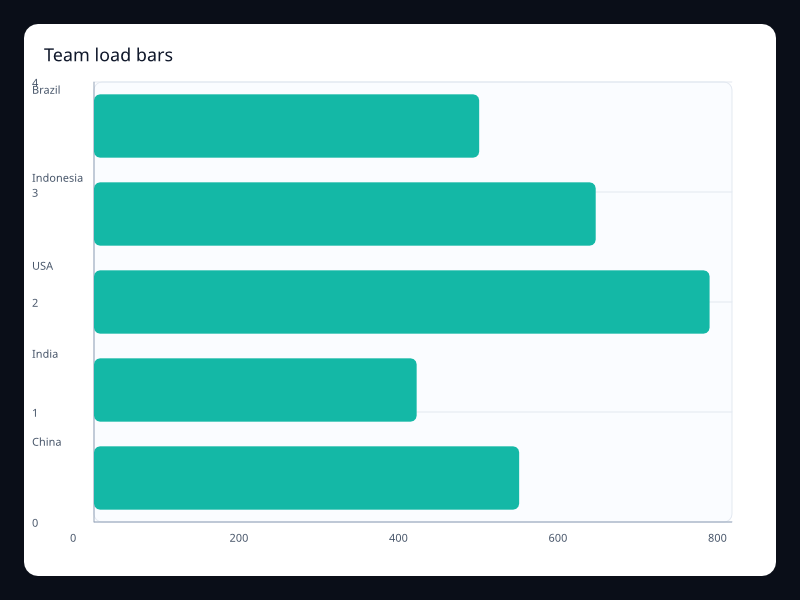
Team load bars uses Fission Charts typed Rust data to render a production-ready bar view. Use it when managers need quick capacity comparison.
Data: Typed chart data, axes, and series.
Use when: Use it when managers need quick capacity comparison
Tags: bar
Ticket age distribution
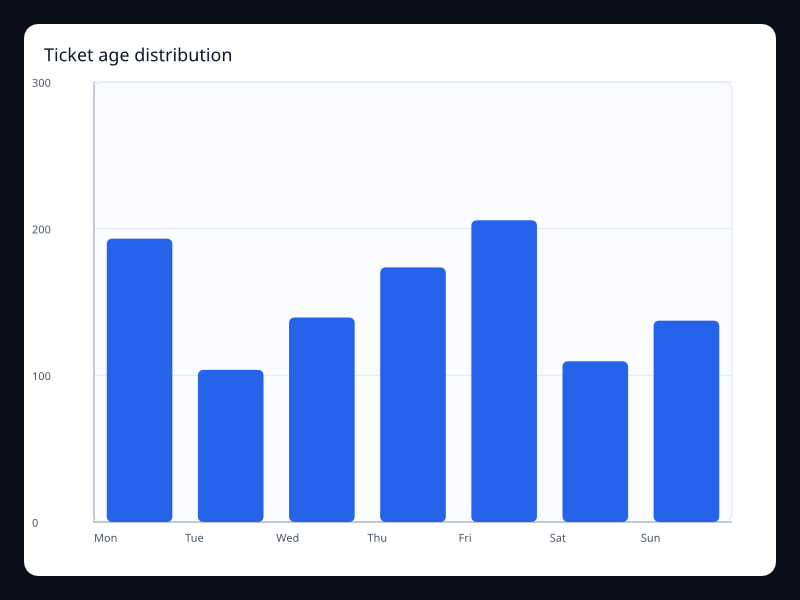
Ticket age distribution uses Fission Charts typed Rust data to render a production-ready bar view. Use it when the reader needs the shape of a queue.
Data: Typed chart data, axes, and series.
Use when: Use it when the reader needs the shape of a queue
Tags: bar
Track progress bars
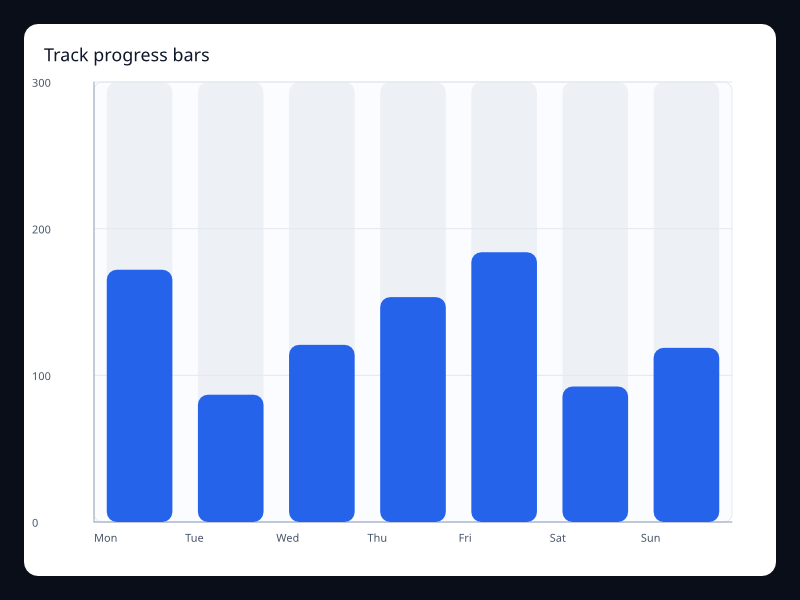
Bars shown against full-range tracks. Use it for completion and capacity comparisons.
Data: Typed chart data, axes, and series.
Use when: Use it for completion and capacity comparisons
Tags: bar
Utilization capacity
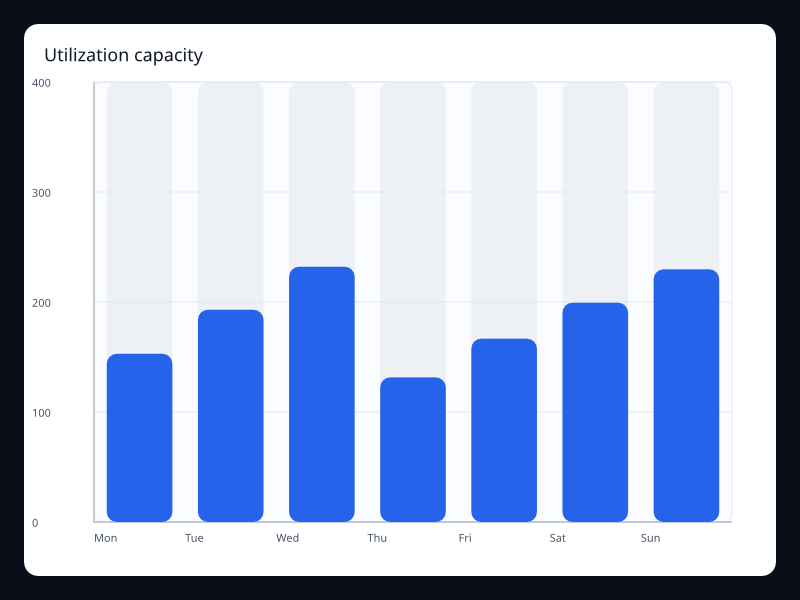
Utilization capacity uses Fission Charts typed Rust data to render a production-ready bar view. Use it for infrastructure and quota dashboards.
Data: Typed chart data, axes, and series.
Use when: Use it for infrastructure and quota dashboards
Tags: bar
Waterfall bar
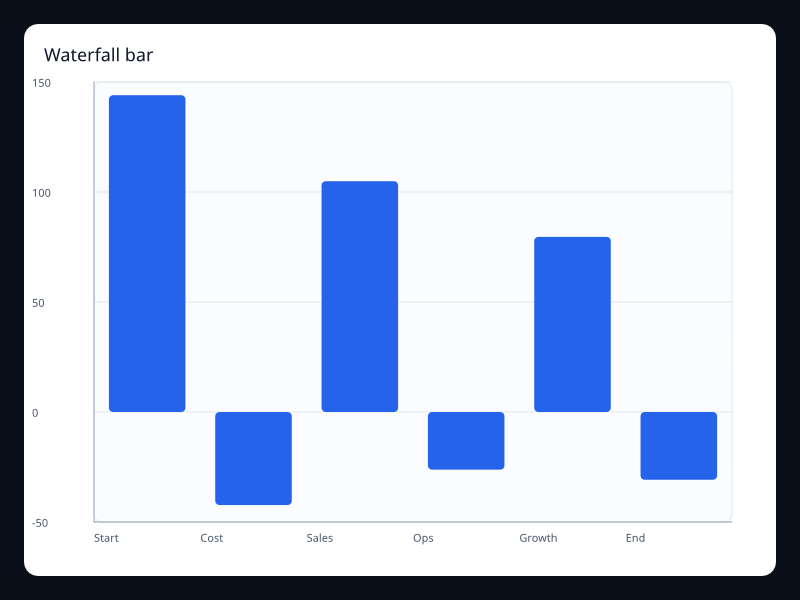
Sequential changes displayed as rising and falling bars. Use it for profit bridges and cumulative change explanations.
Data: Typed chart data, axes, and series.
Use when: Use it for profit bridges and cumulative change explanations
Tags: bar
Weekday shape bars
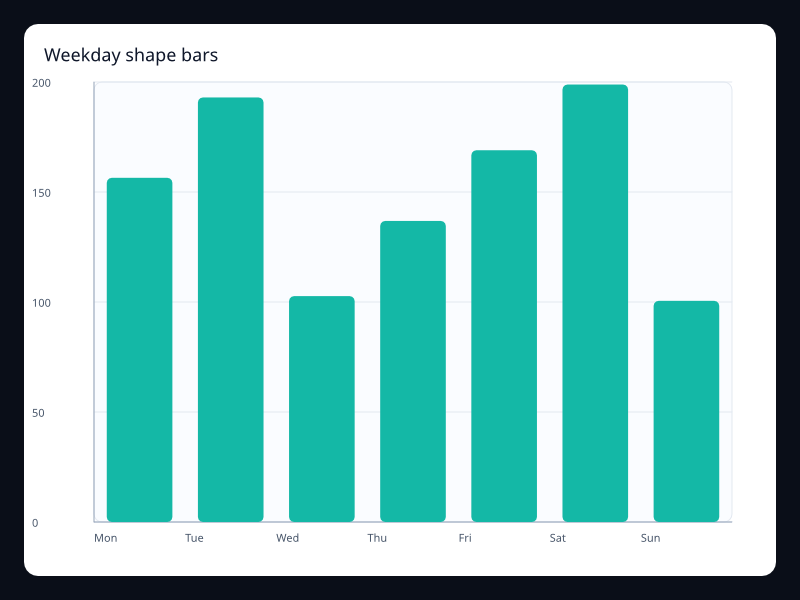
Weekday shape bars uses Fission Charts typed Rust data to render a production-ready bar view. Use it when the weekly rhythm is easier as bars than a line.
Data: Typed chart data, axes, and series.
Use when: Use it when the weekly rhythm is easier as bars than a line
Tags: bar
Wide-label horizontal bars
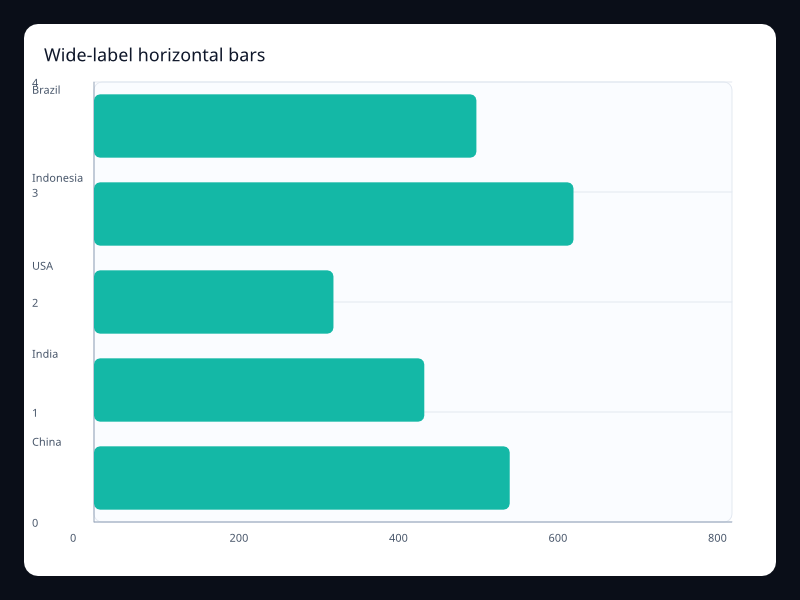
Horizontal layout preserving long category labels. Use it when labels would collide on the x-axis.
Data: Typed chart data, axes, and series.
Use when: Use it when labels would collide on the x-axis
Tags: bar
Cartesian
Bar with background
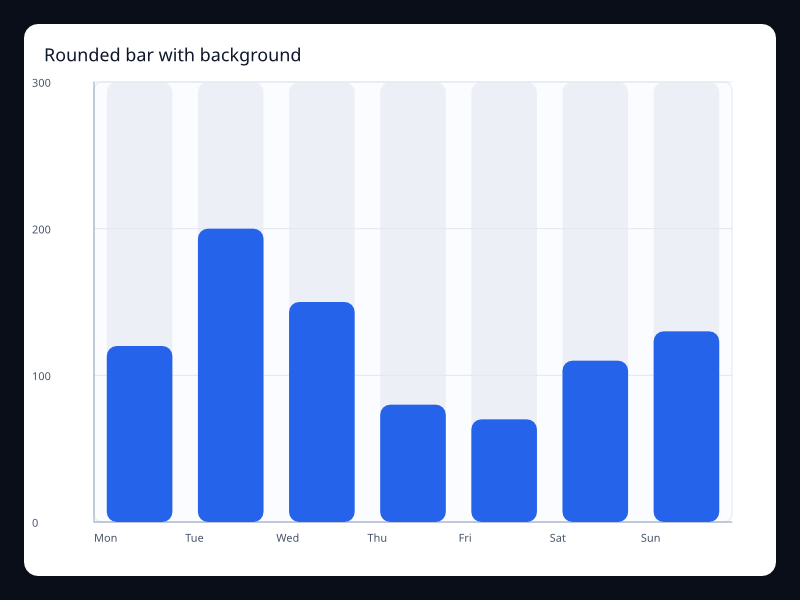
Rounded bars drawn over a full-range background track. Use it for progress-like category comparisons where the maximum should remain visible.
Data: Typed chart data, axes, and series.
Use when: Use it for progress-like category comparisons where the maximum should remain visible
Tags: bar
Basic bar
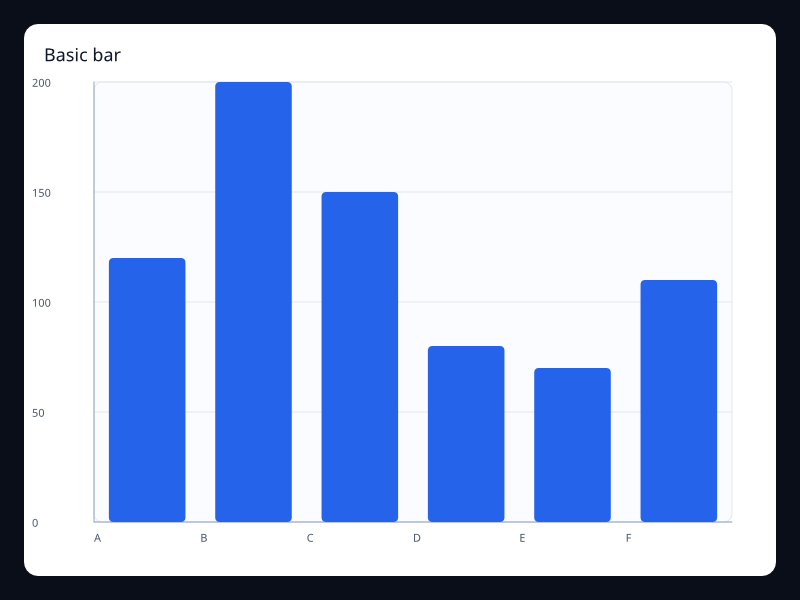
A category comparison using rectangular bars. Use it when individual values need easy comparison.
Data: Typed chart data, axes, and series.
Use when: Use it when individual values need easy comparison
Tags: bar
Grouped bar
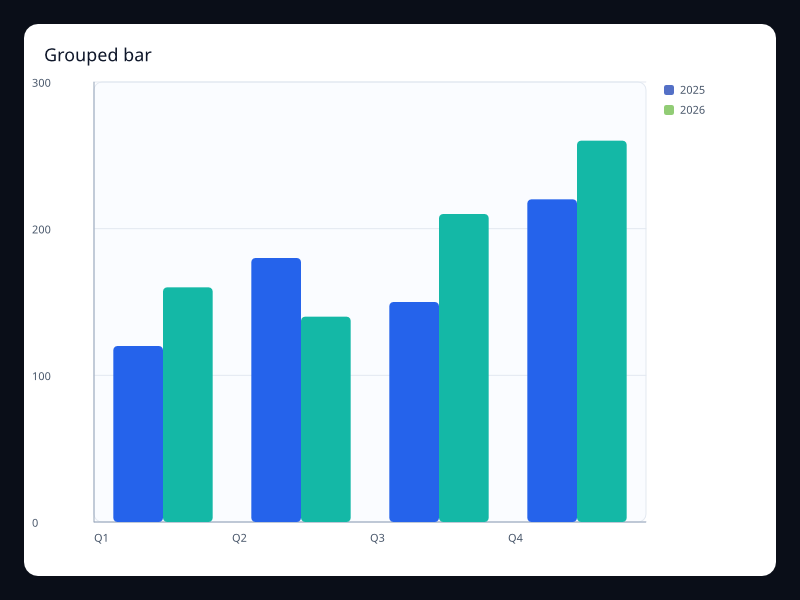
Several bar series shown side by side for each category. Use it to compare related measures within each group.
Data: Typed chart data, axes, and series.
Use when: Use it to compare related measures within each group
Tags: bar
Horizontal bar
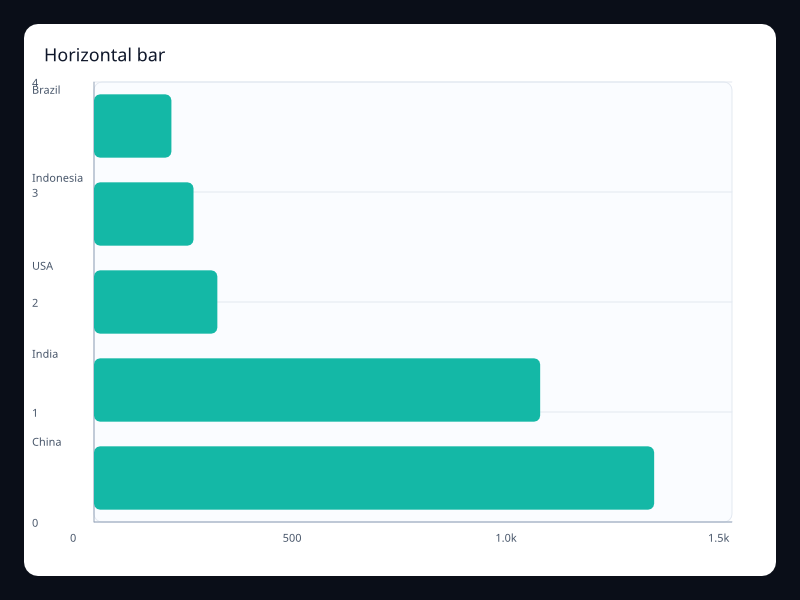
A category comparison with value length running left to right. Use it when category labels are long or ranking order is more important than time order.
Data: Typed chart data, axes, and series.
Use when: Use it when category labels are long or ranking order is more important than time order
Tags: bar
Positive and negative bar
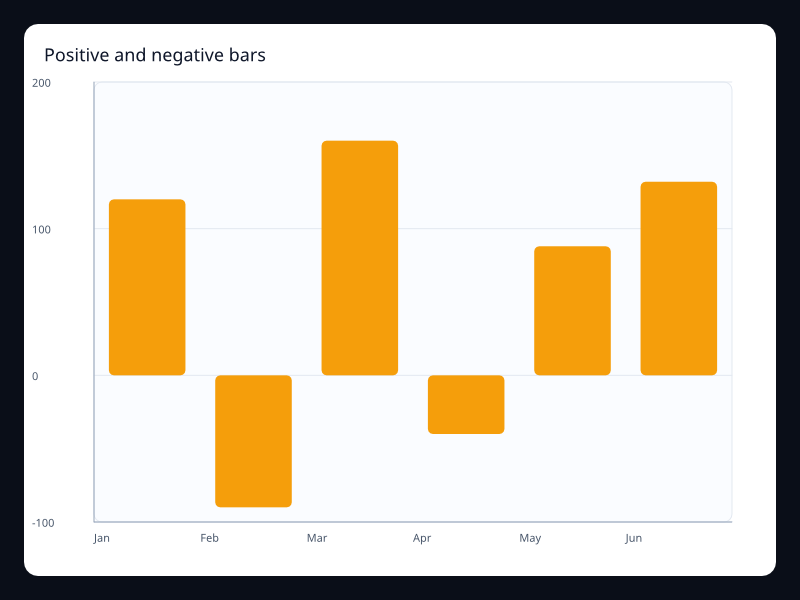
Bars extending above and below the zero baseline. Use it for deltas, profit/loss, variance, and month-over-month movement.
Data: Typed chart data, axes, and series.
Use when: Use it for deltas, profit/loss, variance, and month-over-month movement
Tags: bar
Stacked bar
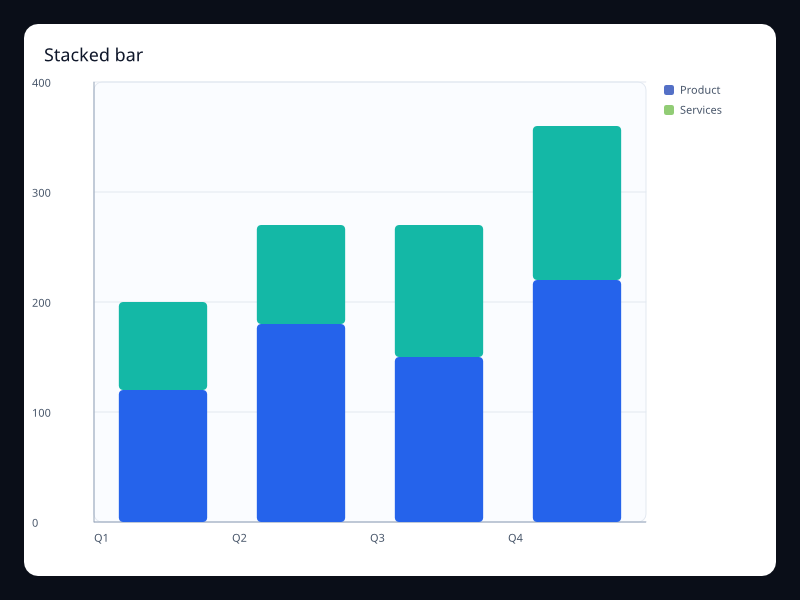
Bars stacked into a cumulative total for each category. Use it to show composition and total at the same time.
Data: Typed chart data, axes, and series.
Use when: Use it to show composition and total at the same time
Tags: bar
Area line
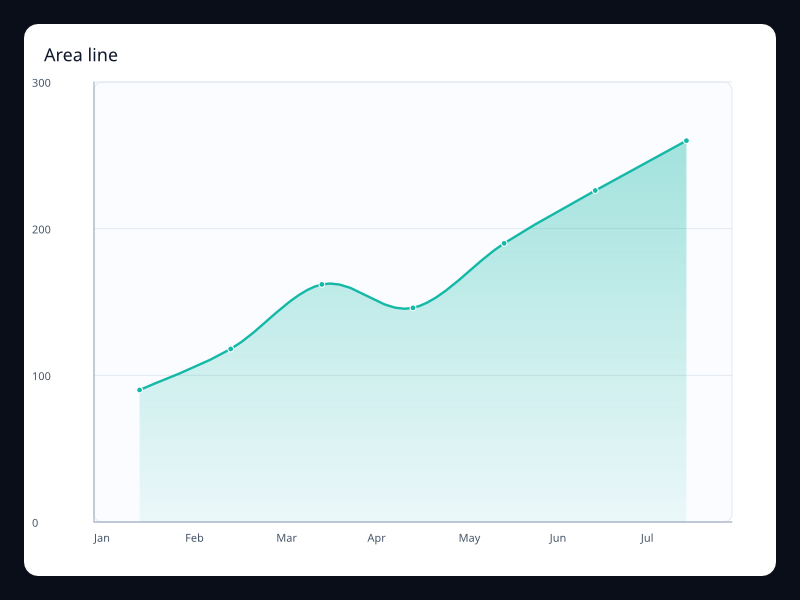
A line with filled area to emphasize magnitude over time. Use it when total volume is as important as the outline.
Data: Typed chart data, axes, and series.
Use when: Use it when total volume is as important as the outline
Tags: line
Basic line
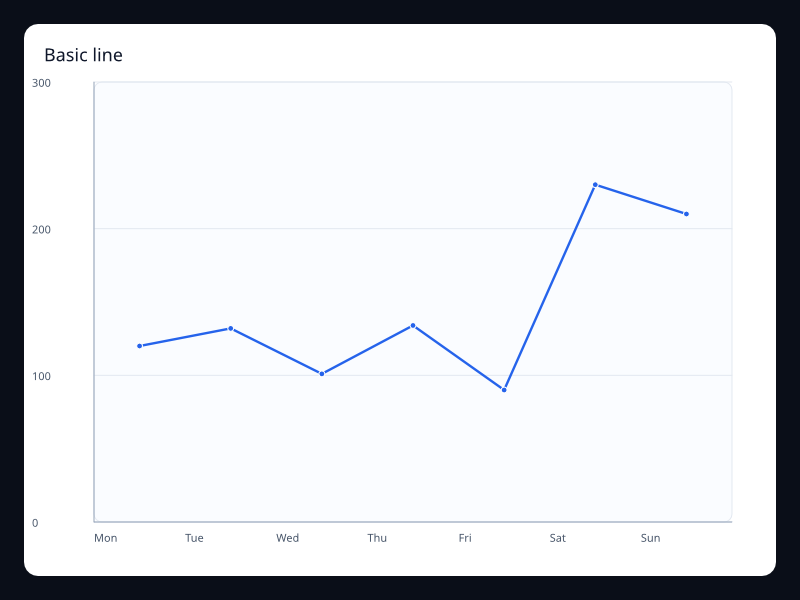
A single ordered numeric series with a clear trend line. Use it when the shape of change matters more than individual bars.
Data: Typed chart data, axes, and series.
Use when: Use it when the shape of change matters more than individual bars
Tags: line
Large line
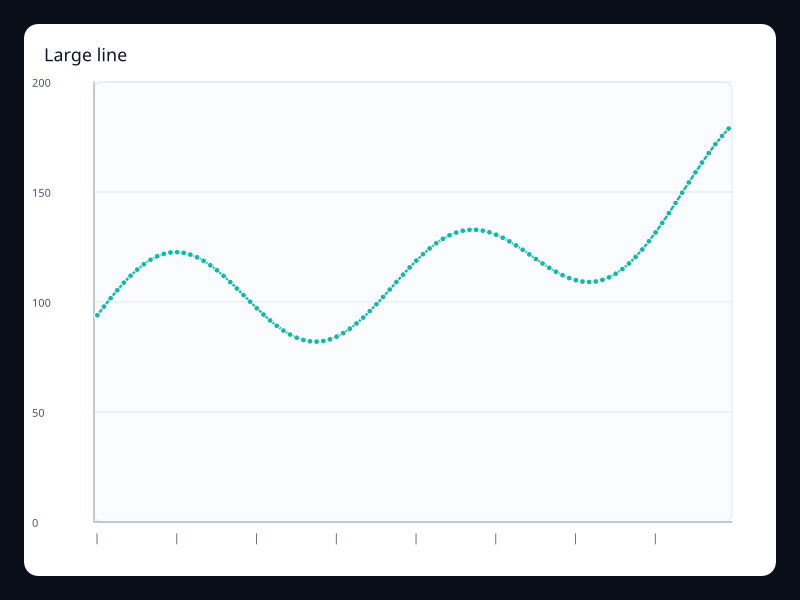
A dense ordered series rendered as a continuous trend without changing the app model. Use it for telemetry, monitoring, and sampled metrics where the trend matters more than every label.
Data: Typed chart data, axes, and series.
Use when: Use it for telemetry, monitoring, and sampled metrics where the trend matters more than every label
Tags: line
Smooth line
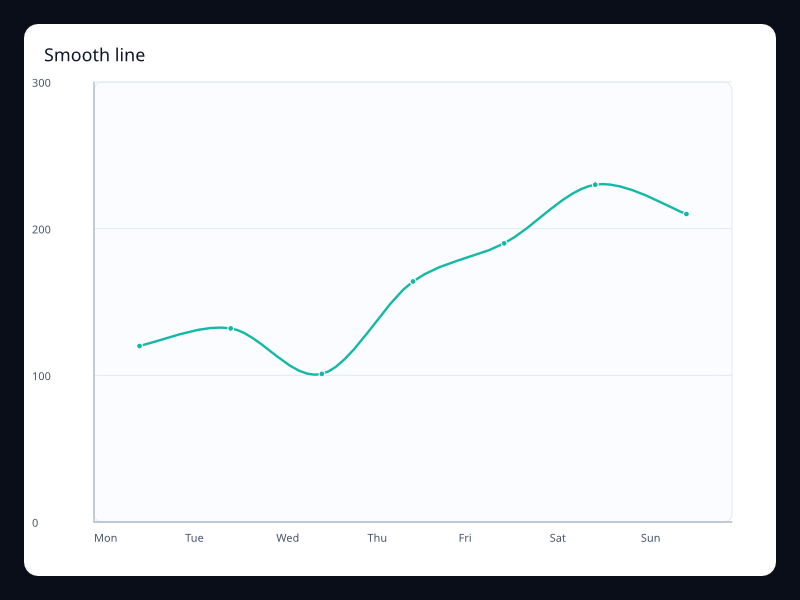
A continuous line with curve interpolation for softer trend reading. Use it for dashboards where the series is sampled often enough to justify interpolation.
Data: Typed chart data, axes, and series.
Use when: Use it for dashboards where the series is sampled often enough to justify interpolation
Tags: line
Stacked area
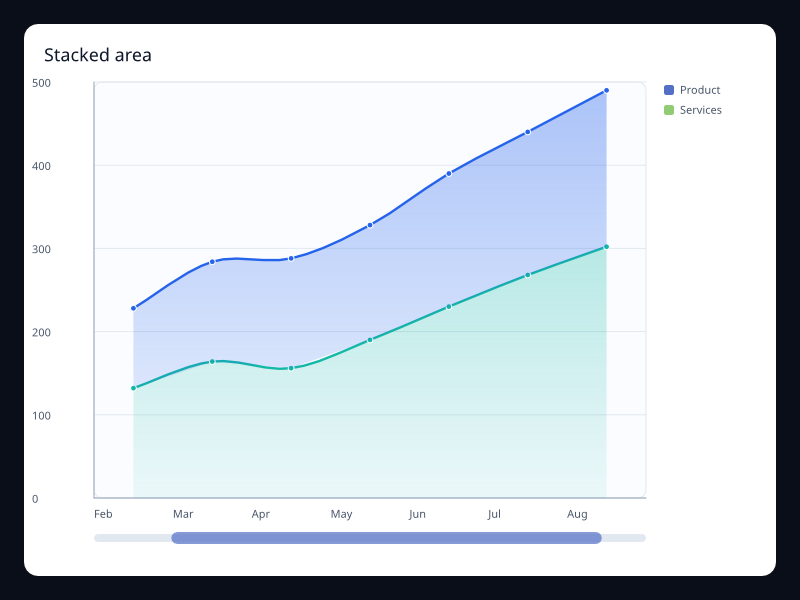
Multiple area series stacked into one total. Use it to show composition over time without losing the total.
Data: Typed chart data, axes, and series.
Use when: Use it to show composition over time without losing the total
Tags: line
Step line
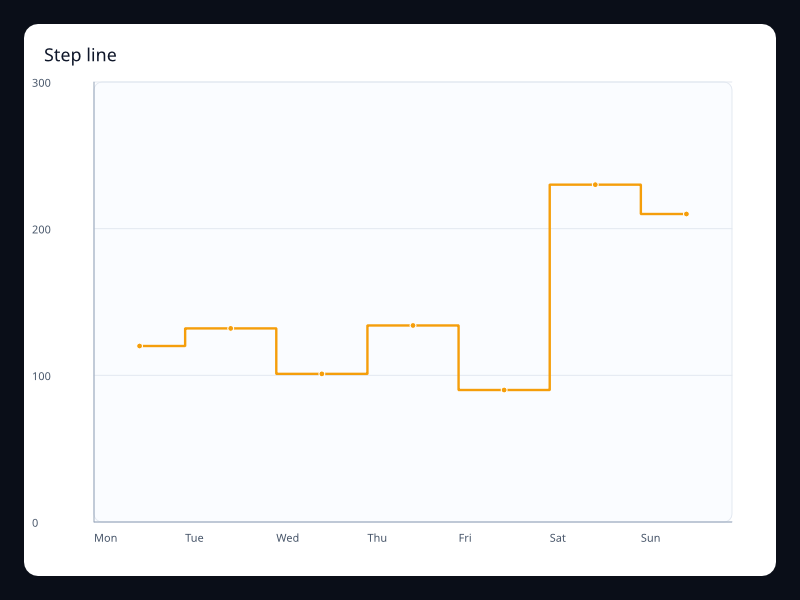
A line that changes in discrete jumps instead of continuous slopes. Use it for counters, states, quotas, and event-driven changes.
Data: Typed chart data, axes, and series.
Use when: Use it for counters, states, quotas, and event-driven changes
Tags: line
Pictorial bar
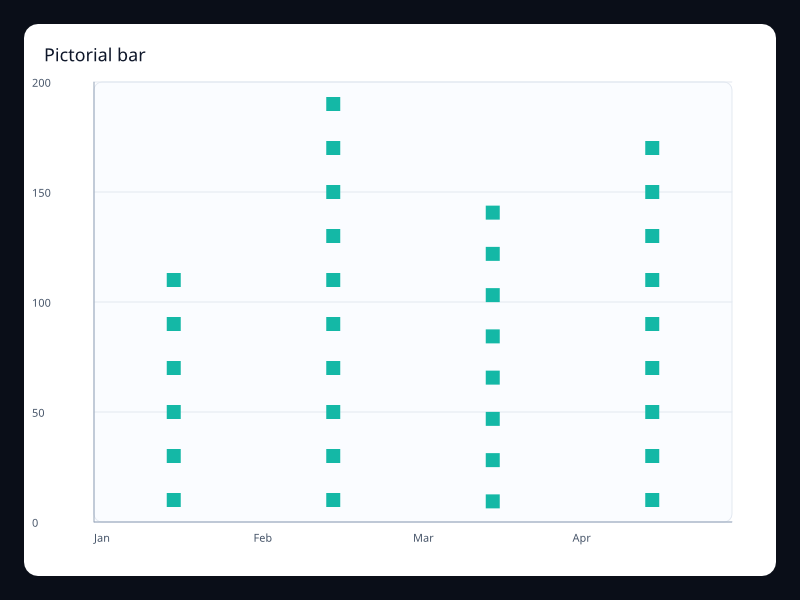
Bars represented by repeated symbols or a custom path. Use it when the chart should feel branded without giving up scale.
Data: Typed chart data, axes, and series.
Use when: Use it when the chart should feel branded without giving up scale
Tags: bar
Components And Interaction
Brush selection
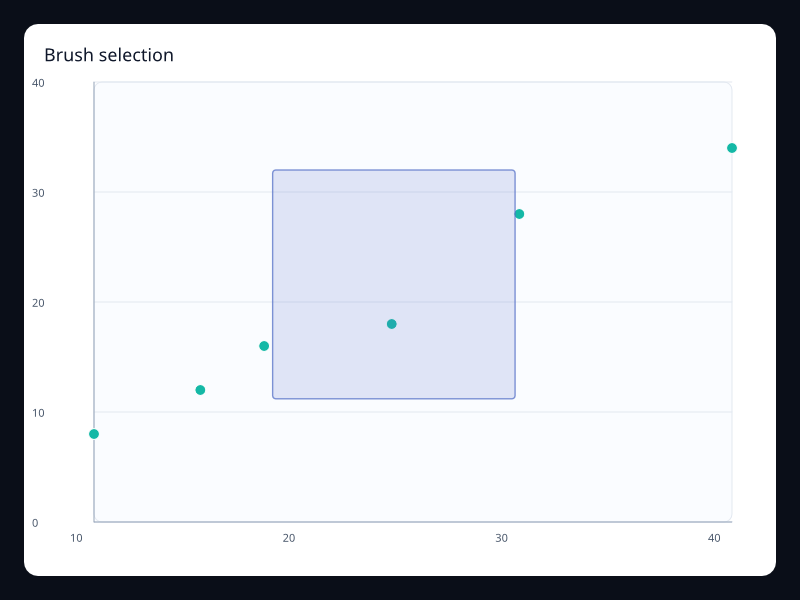
A visible brush region over a scatter plot. Use it when users need to select or inspect a region of points.
Data: Typed chart data, axes, and series.
Use when: Use it when users need to select or inspect a region of points
Tags: brush
Brush horizontal
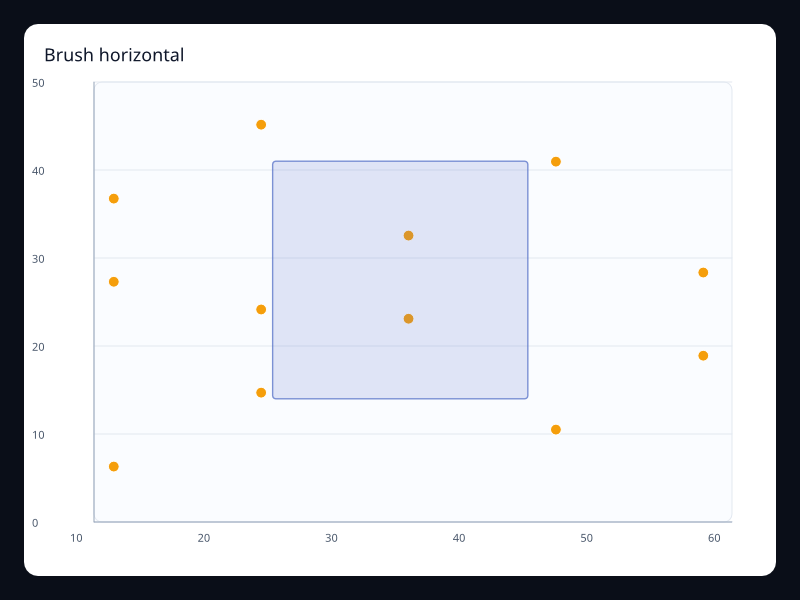
Horizontal brush preview over scatter data. Use it for x-range selection.
Data: Typed chart data, axes, and series.
Use when: Use it for x-range selection
Tags: brush
Brush rectangle
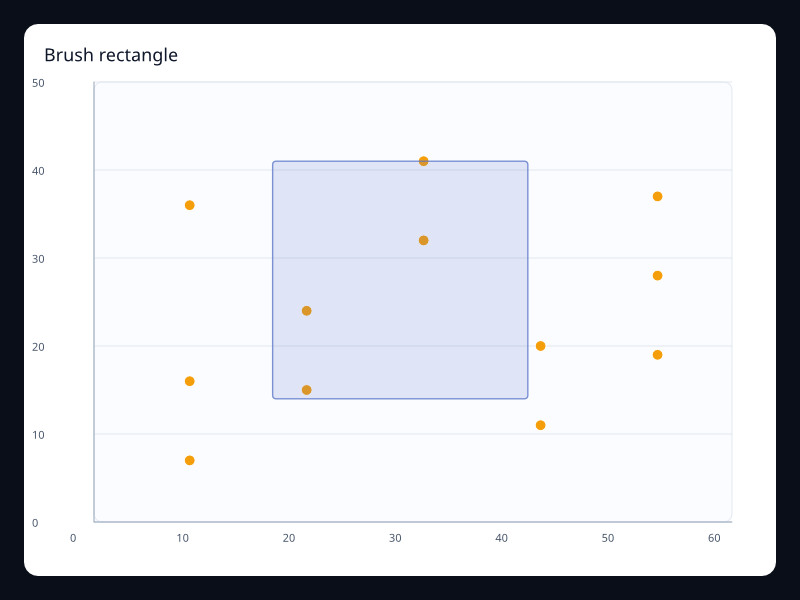
Rectangular brush preview over a scatter plot. Use it for region selection.
Data: Typed chart data, axes, and series.
Use when: Use it for region selection
Tags: brush
Data zoom long
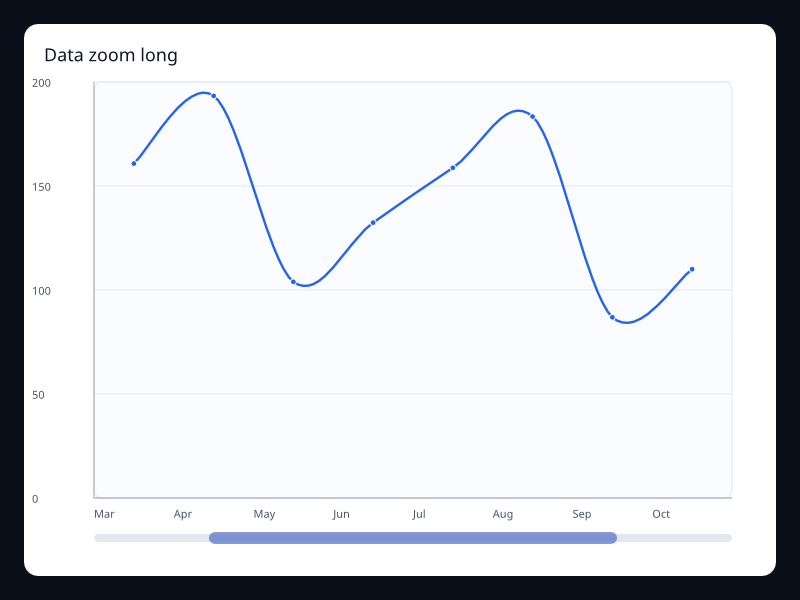
Wide data zoom window over ordered data. Use it for dashboards with focus ranges.
Data: Typed chart data, axes, and series.
Use when: Use it for dashboards with focus ranges
Tags: dataZoom
Data zoom short
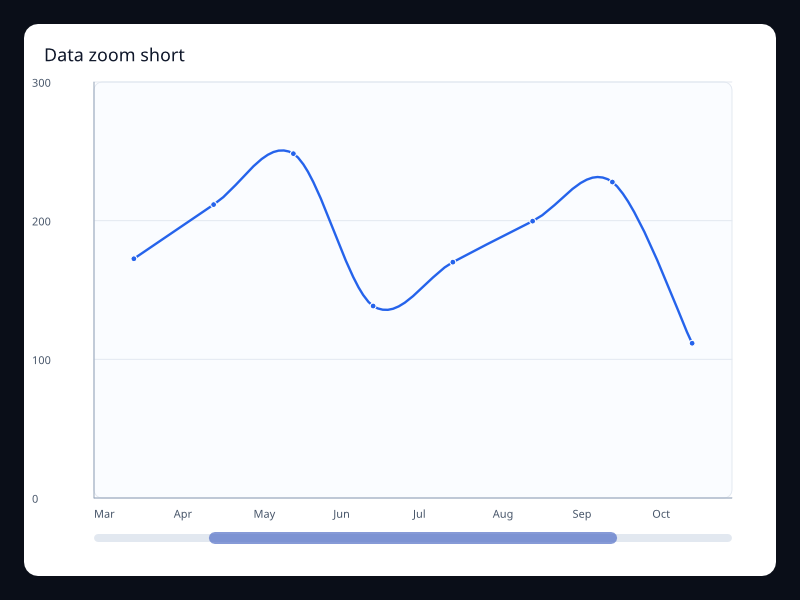
Small data zoom window over ordered data. Use it for local inspection of long series.
Data: Typed chart data, axes, and series.
Use when: Use it for local inspection of long series
Tags: dataZoom
Graphic band
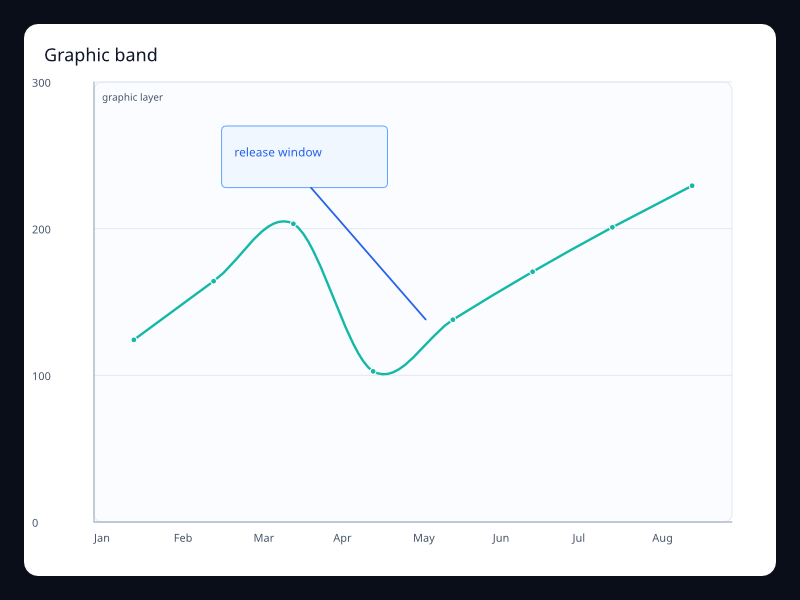
Graphic highlight and label overlay. Use it for release windows and custom callouts.
Data: Typed chart data, axes, and series.
Use when: Use it for release windows and custom callouts
Tags: graphic
Graphic callout
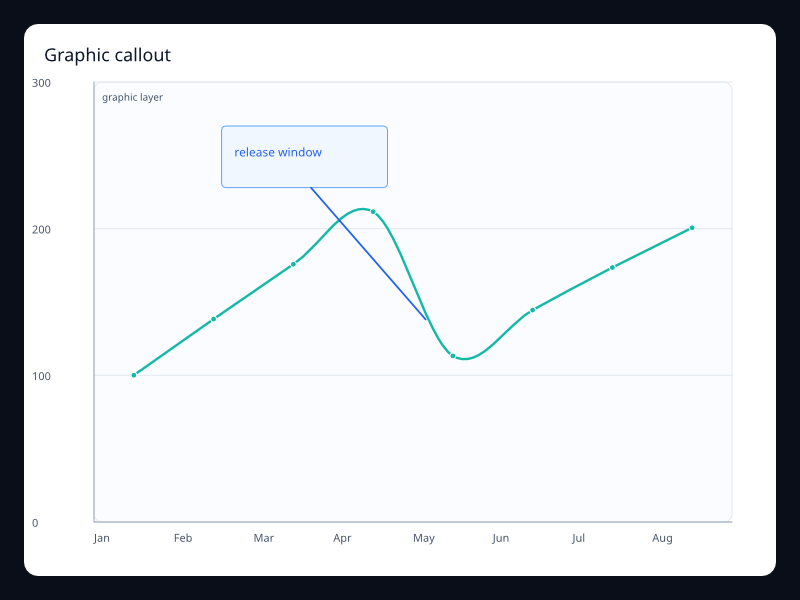
Graphic annotation overlay on a line chart. Use it to explain a change in context.
Data: Typed chart data, axes, and series.
Use when: Use it to explain a change in context
Tags: graphic
Mark area component
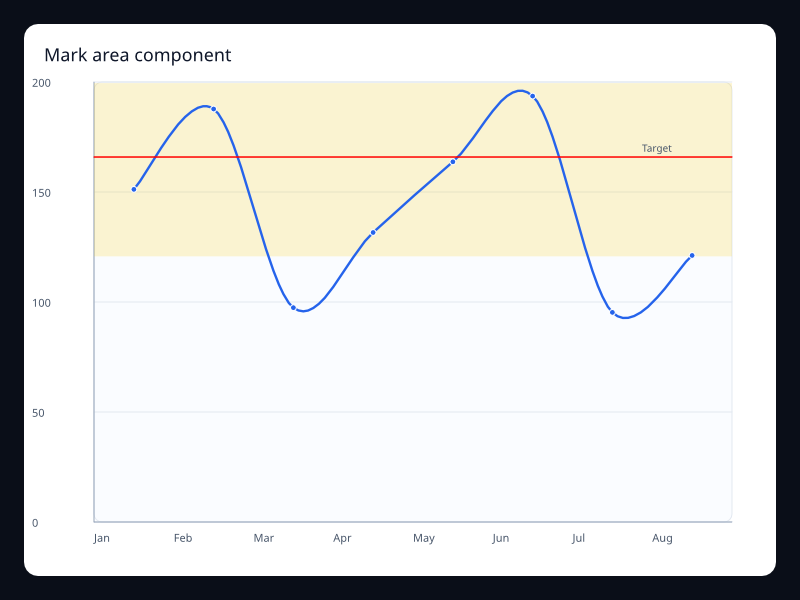
Line chart with a highlighted range. Use it for safe operating zones.
Data: Typed chart data, axes, and series.
Use when: Use it for safe operating zones
Tags: markArea
Mark line component
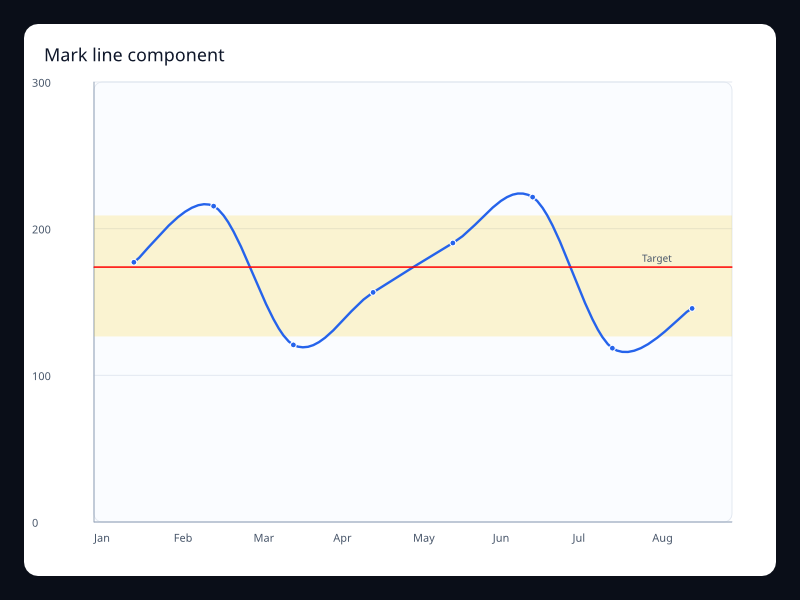
Line chart with target threshold line. Use it for goals and alert thresholds.
Data: Typed chart data, axes, and series.
Use when: Use it for goals and alert thresholds
Tags: markLine
Mark point component
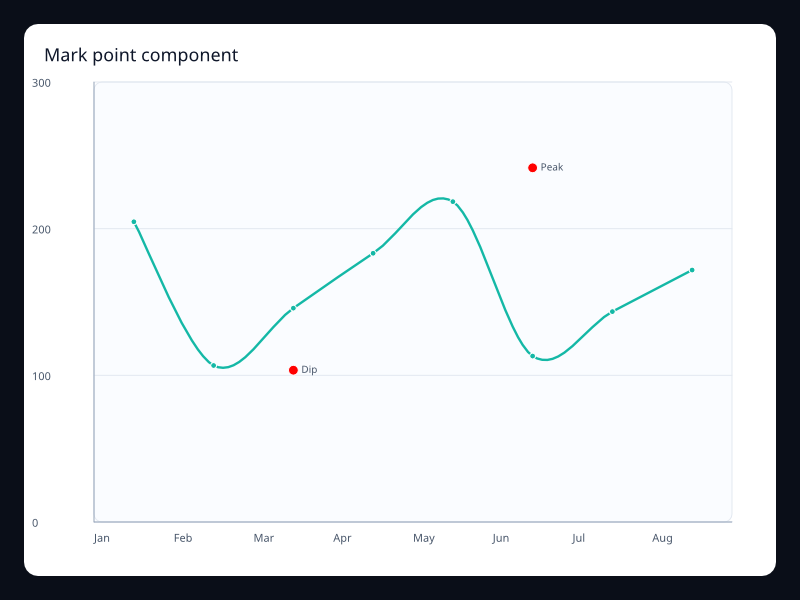
Line chart with named event points. Use it for incidents and milestones.
Data: Typed chart data, axes, and series.
Use when: Use it for incidents and milestones
Tags: markPoint
Timeline releases
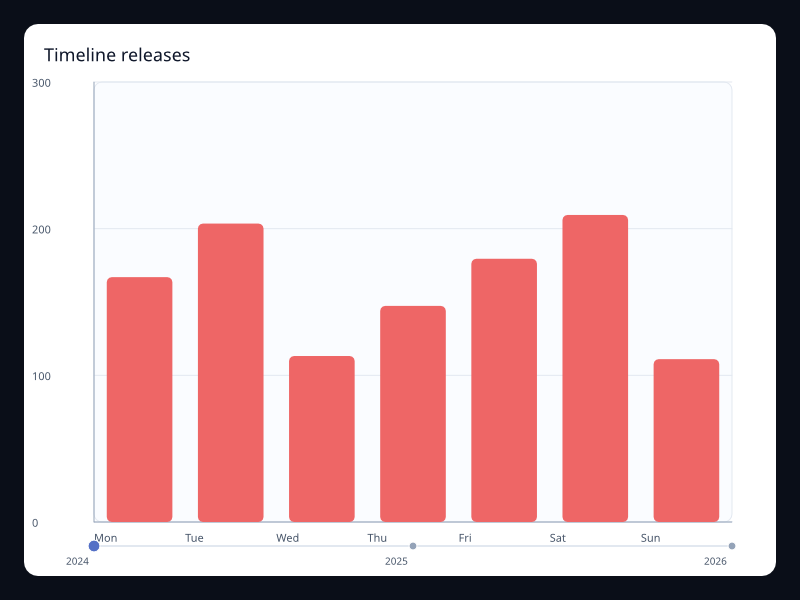
Timeline component for release phases. Use it for phase or scenario playback.
Data: Typed chart data, axes, and series.
Use when: Use it for phase or scenario playback
Tags: timeline
Timeline years
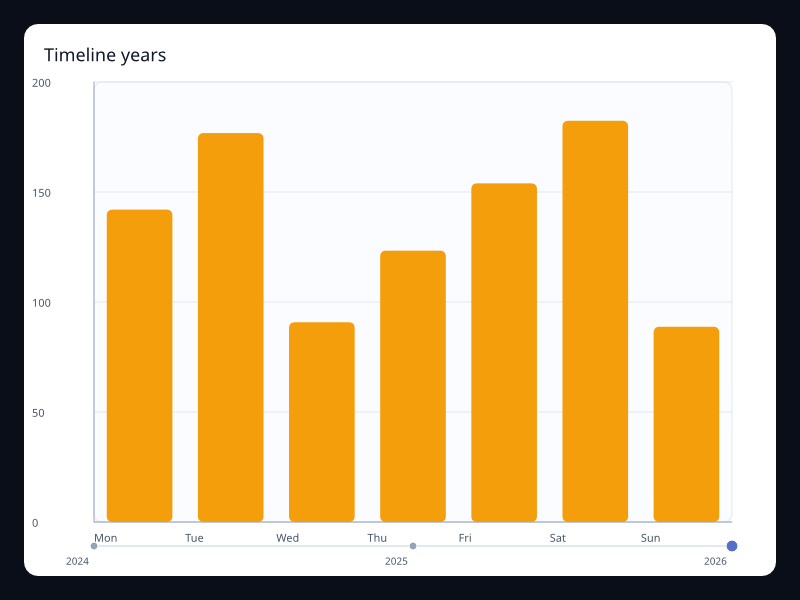
Timeline component selecting a year. Use it for step-based snapshots.
Data: Typed chart data, axes, and series.
Use when: Use it for step-based snapshots
Tags: timeline
Toolbox full
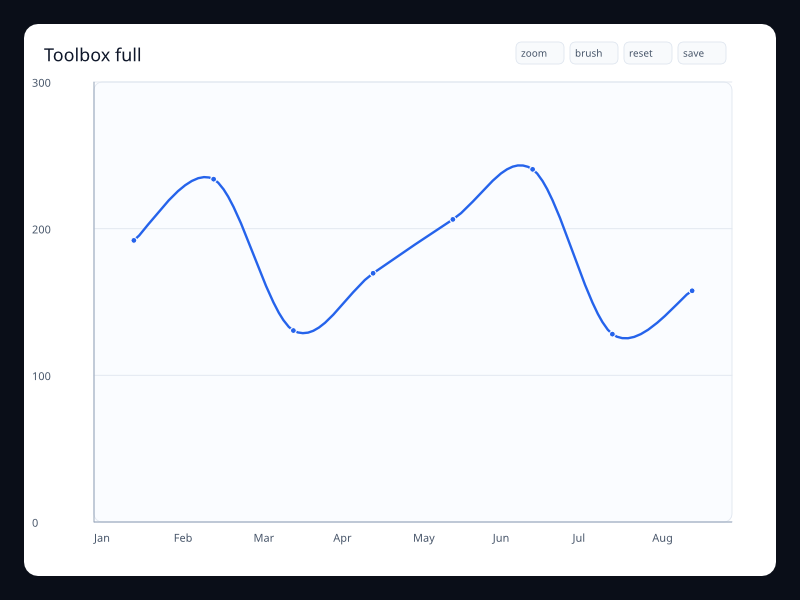
Full toolbox action set. Use it when a chart supports several operations.
Data: Typed chart data, axes, and series.
Use when: Use it when a chart supports several operations
Tags: toolbox
Toolbox zoom
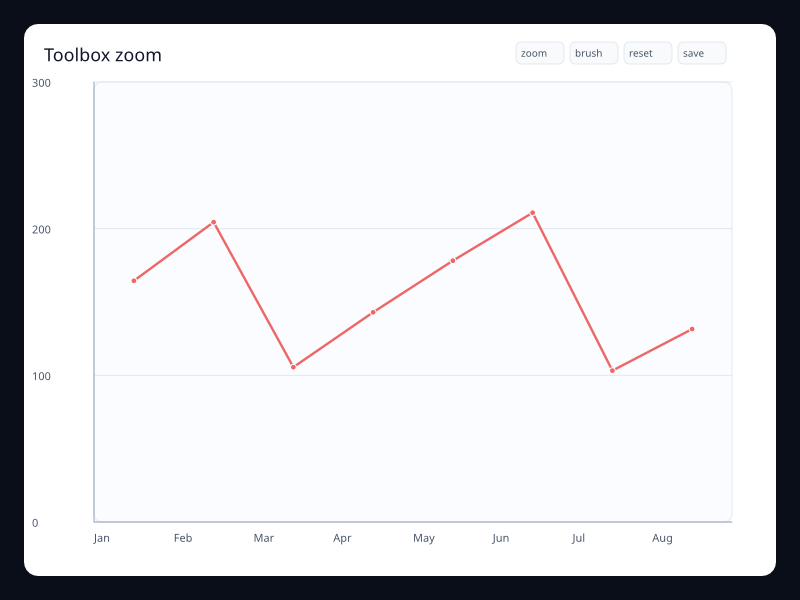
Toolbox actions rendered near the chart. Use it for chart utility operations.
Data: Typed chart data, axes, and series.
Use when: Use it for chart utility operations
Tags: toolbox
Tooltip axis component
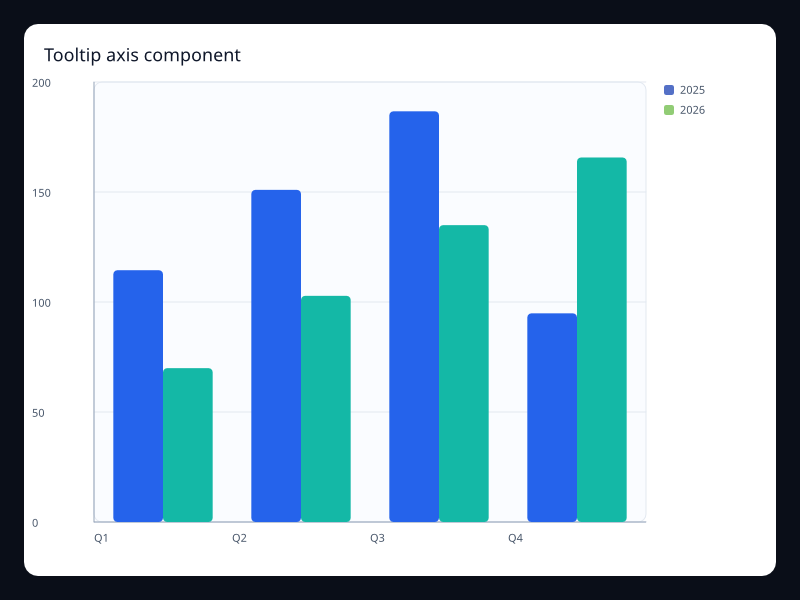
Axis tooltip over shared bar and line data. Use it for exact values across series.
Data: Typed chart data, axes, and series.
Use when: Use it for exact values across series
Tags: tooltip
Tooltip item component
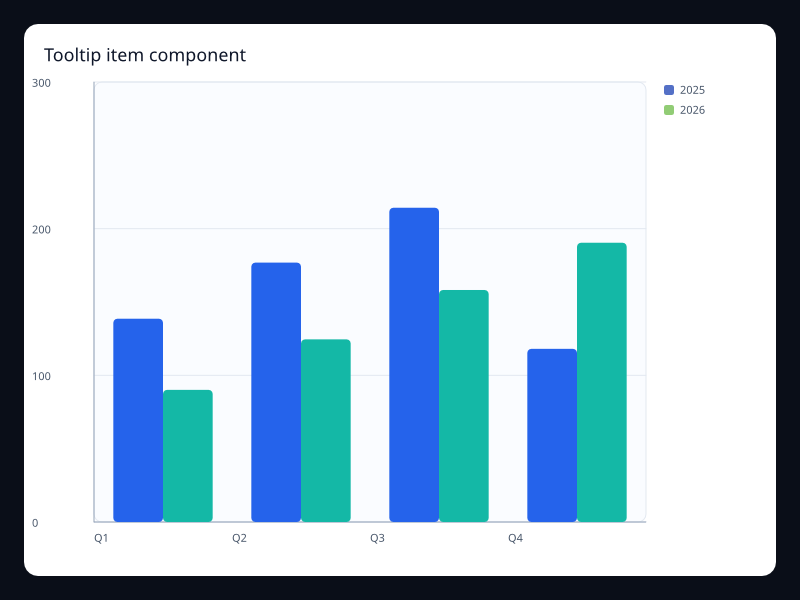
Item tooltip over single series data. Use it for exact item readout.
Data: Typed chart data, axes, and series.
Use when: Use it for exact item readout
Tags: tooltip
Visual map component
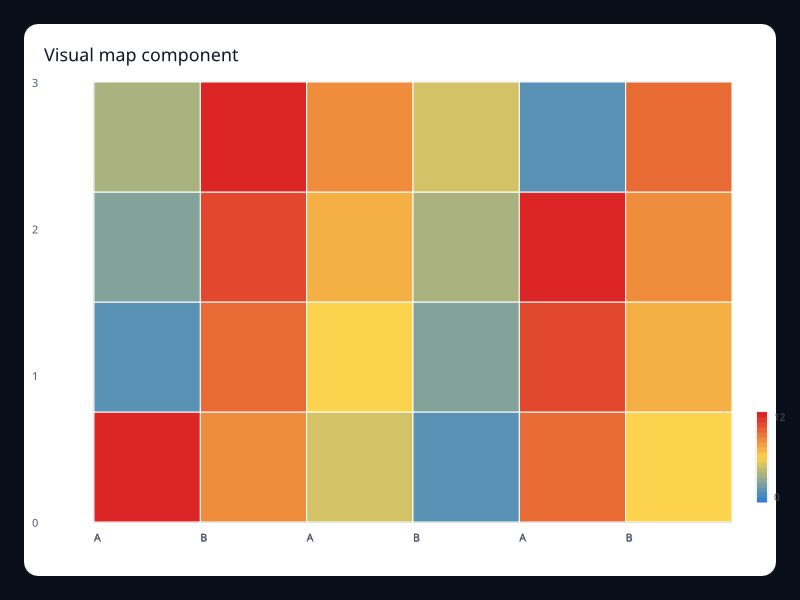
Visible color scale for heatmap values. Use it where color represents a numeric value.
Data: Typed chart data, axes, and series.
Use when: Use it where color represents a numeric value
Tags: visualMap
Data zoom
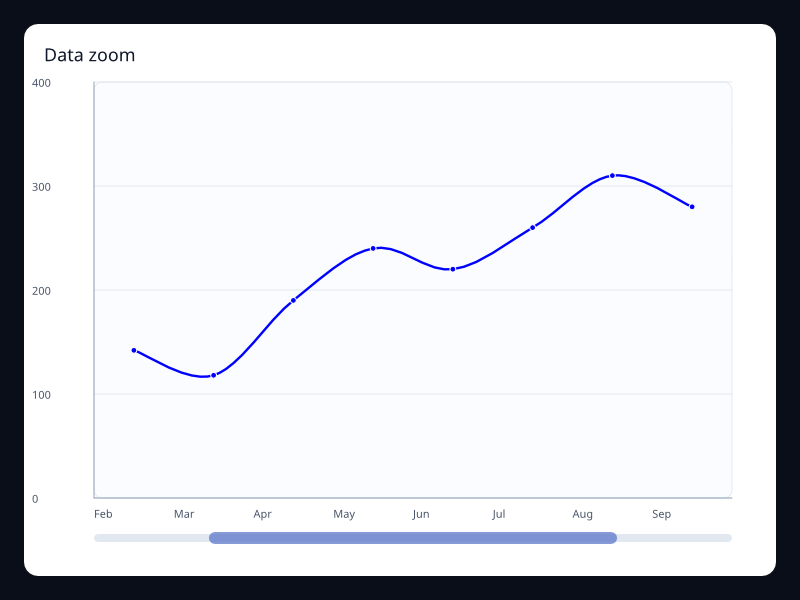
A slider selection that limits the visible portion of ordered data. Use it when the user needs to inspect a slice of a longer series without leaving context.
Data: Typed chart data, axes, and series.
Use when: Use it when the user needs to inspect a slice of a longer series without leaving context
Tags: dataZoom
Graphic overlay
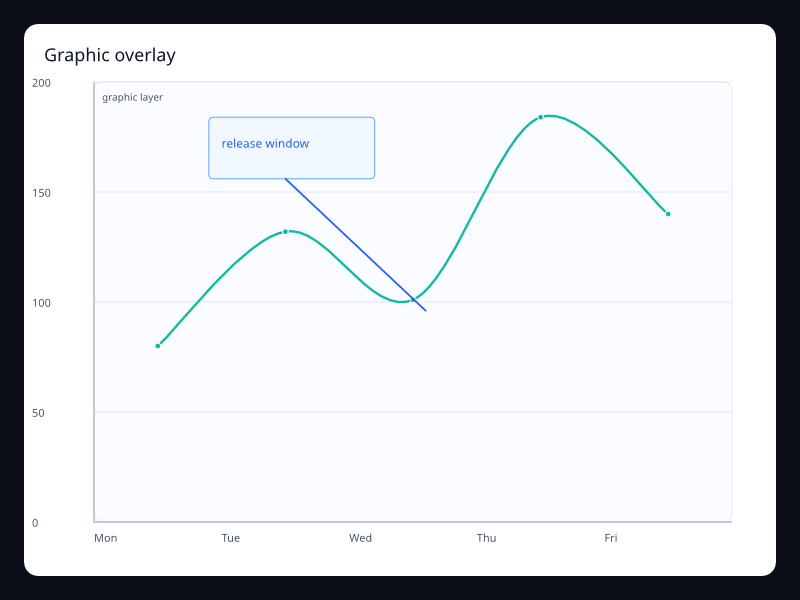
Typed graphic shapes and text layered over the chart plot area. Use it for callouts, annotations, labels, and lightweight explanatory overlays.
Data: Typed chart data, axes, and series.
Use when: Use it for callouts, annotations, labels, and lightweight explanatory overlays
Tags: graphic
Mark line and point
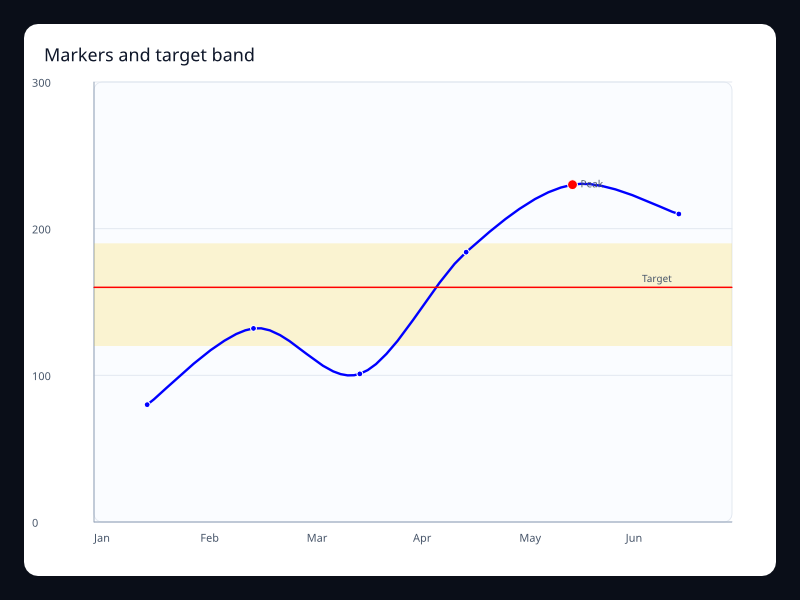
Target bands, threshold lines, and named points layered over cartesian data. Use it to explain thresholds, goals, anomalies, or operational bands directly on the chart.
Data: Typed chart data, axes, and series.
Use when: Use it to explain thresholds, goals, anomalies, or operational bands directly on the chart
Tags: markPoint
Timeline
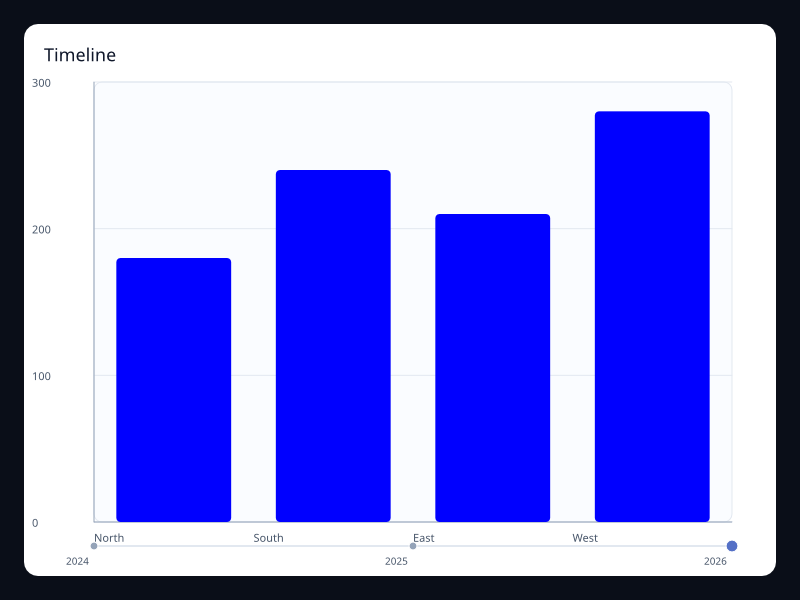
A timeline control rendered with active state and labeled stops. Use it to show snapshots, scenario years, deployment phases, or step-based playback.
Data: Typed chart data, axes, and series.
Use when: Use it to show snapshots, scenario years, deployment phases, or step-based playback
Tags: timeline
Toolbox actions
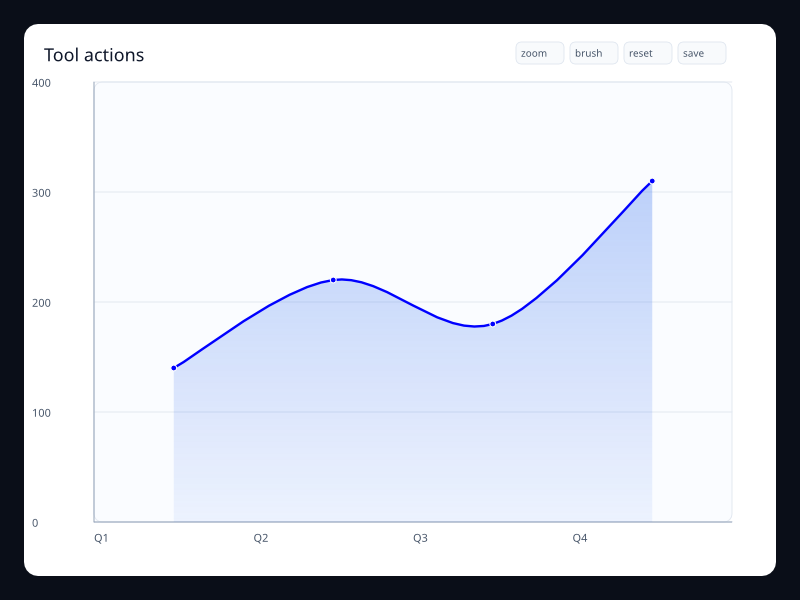
Chart-level tool buttons for restore, save, zoom, and brush actions. Use it when a chart has explicit utility operations that should remain close to the data.
Data: Typed chart data, axes, and series.
Use when: Use it when a chart has explicit utility operations that should remain close to the data
Tags: toolbox
Axis tooltip
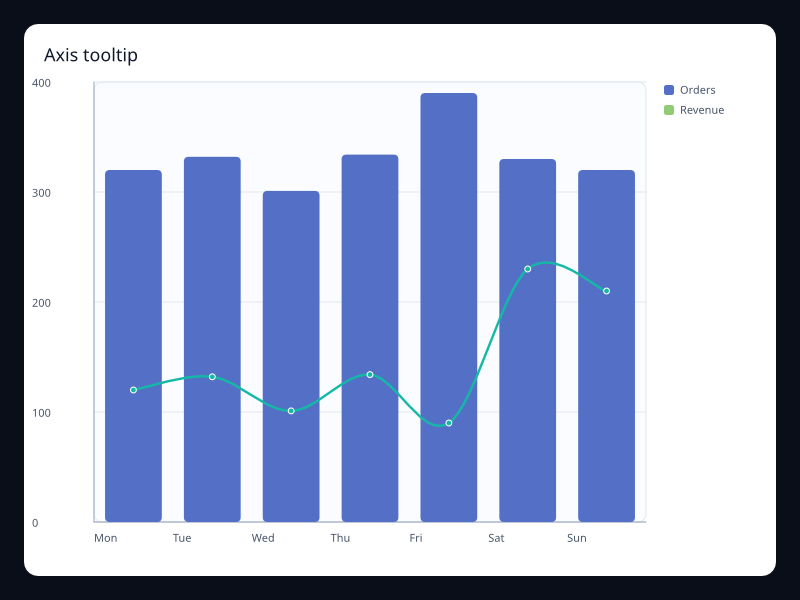
Axis-oriented tooltip configuration and hit-tested chart events. Use it when several series share one x position and the user needs exact values.
Data: Typed chart data, axes, and series.
Use when: Use it when several series share one x position and the user needs exact values
Tags: tooltip
Coordinates
Calendar heatmap
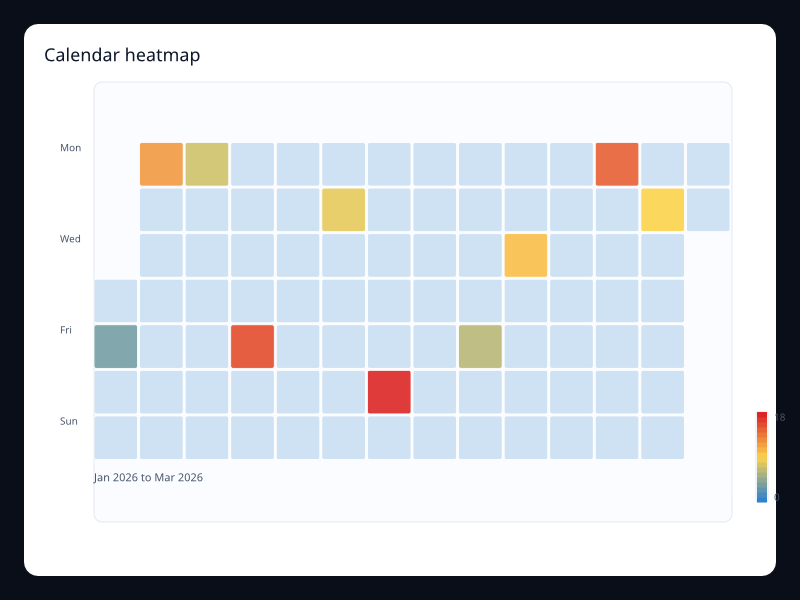
Date values placed into a week-by-day calendar grid. Use it for contribution, activity, incident, and habit patterns over weeks or months.
Data: Typed chart data, axes, and series.
Use when: Use it for contribution, activity, incident, and habit patterns over weeks or months
Tags: calendar
Polar bar
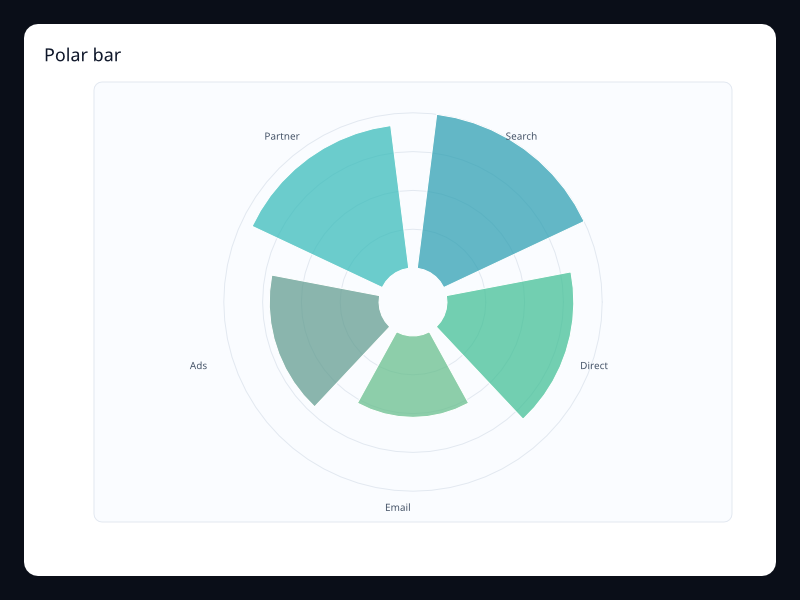
Radial bars placed around a polar coordinate system. Use it when cyclical comparison benefits from circular layout.
Data: Typed chart data, axes, and series.
Use when: Use it when cyclical comparison benefits from circular layout
Tags: polar
Polar line
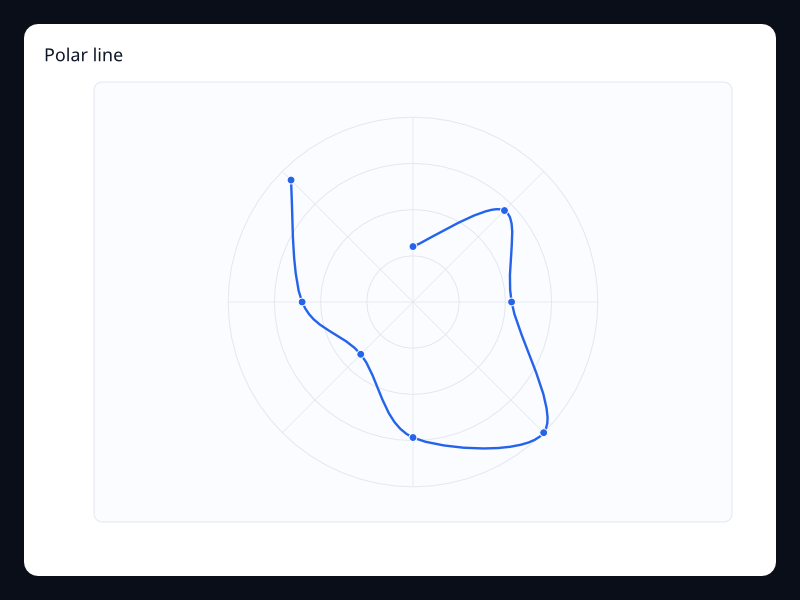
A line series mapped by angle and radius. Use it for wind, direction, periodic signals, and angular measurements.
Data: Typed chart data, axes, and series.
Use when: Use it for wind, direction, periodic signals, and angular measurements
Tags: polar
Single axis
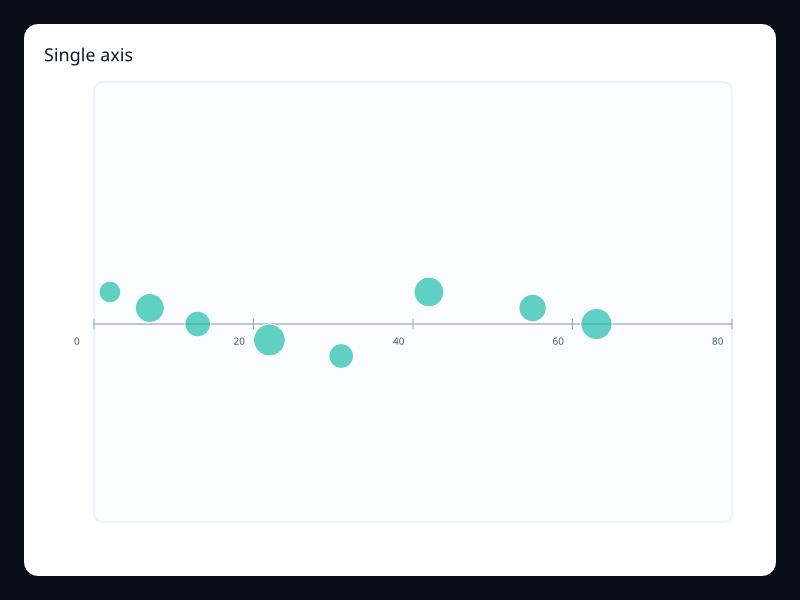
Events or weighted points arranged along one numeric axis. Use it for timelines, distributions, and event density when a second axis would add noise.
Data: Typed chart data, axes, and series.
Use when: Use it for timelines, distributions, and event density when a second axis would add noise
Tags: singleAxis
Data Pipeline And Interaction
Encoded dataset
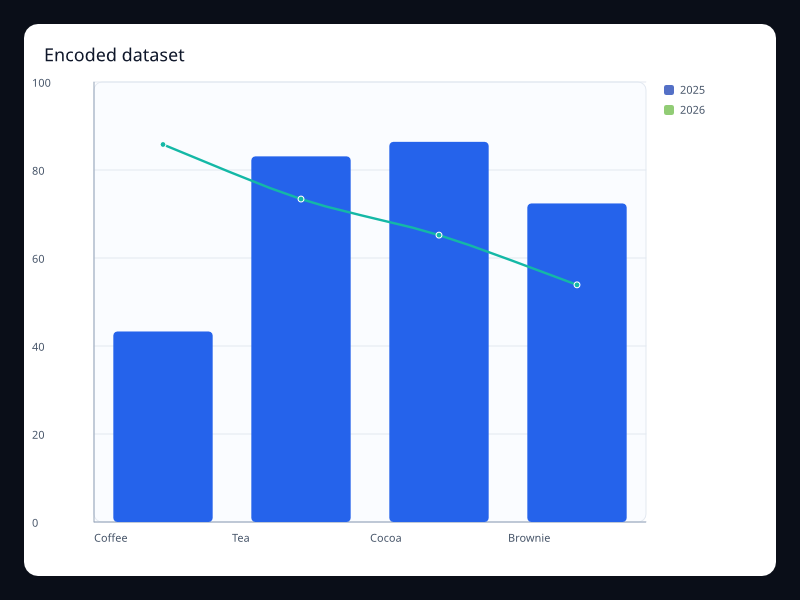
Line and bar series bound to named dataset dimensions. Use it when chart code should name fields instead of copying arrays.
Data: Typed chart data, axes, and series.
Use when: Use it when chart code should name fields instead of copying arrays
Tags: dataset
Visual map
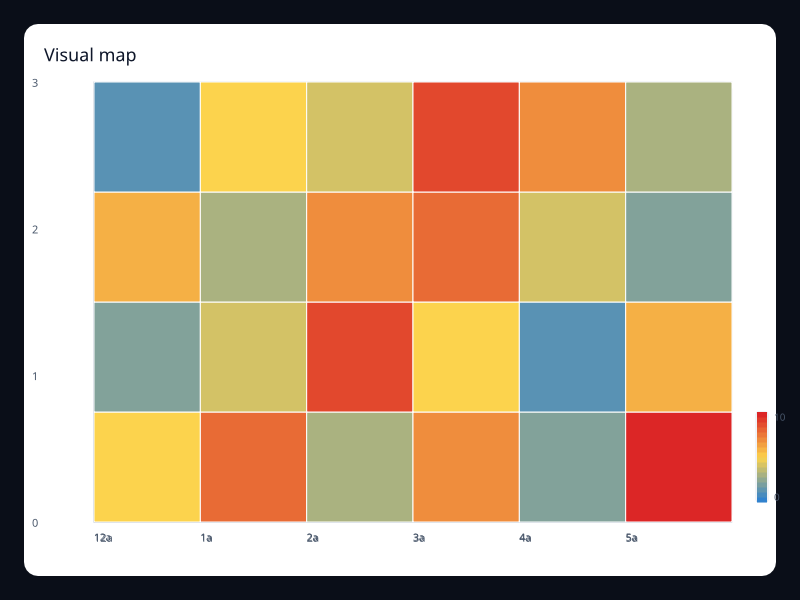
Color encodes a numeric range consistently across a chart. Use it for heatmap and scatter intensity.
Data: Typed chart data, axes, and series.
Use when: Use it for heatmap and scatter intensity
Tags: visual-map
Word cloud
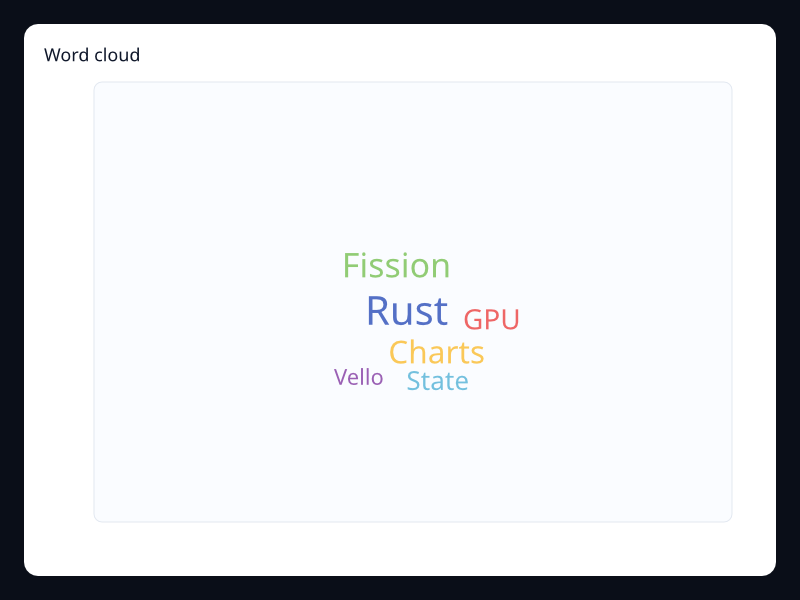
Words sized by weight inside the chart area. Use it for qualitative summaries where exact numeric comparison is less important than emphasis.
Data: Typed chart data, axes, and series.
Use when: Use it for qualitative summaries where exact numeric comparison is less important than emphasis
Tags: wordcloud
Dataset
Calendar dataset activity
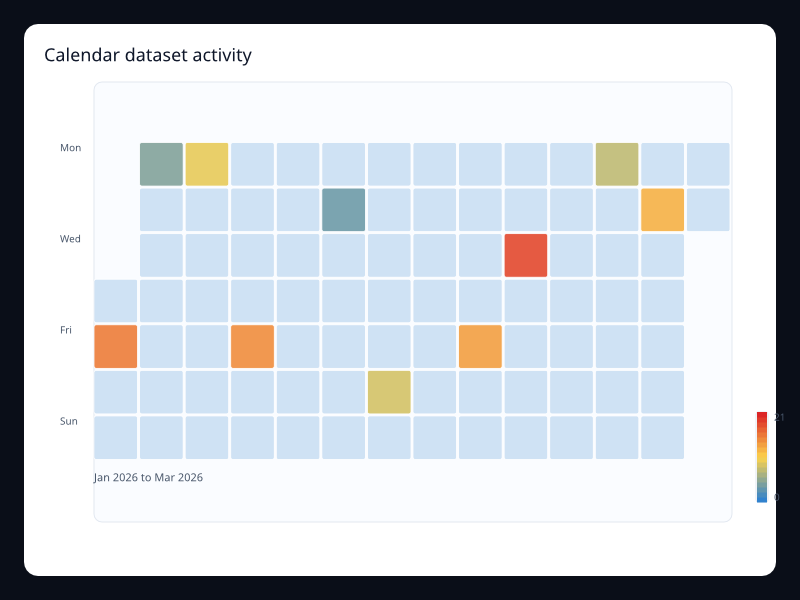
Calendar dataset activity uses Fission Charts typed Rust data to render a production-ready dataset view. Use it when dates are a first-class data field.
Data: Typed chart data, axes, and series.
Use when: Use it when dates are a first-class data field
Tags: dataset
Filtered composition
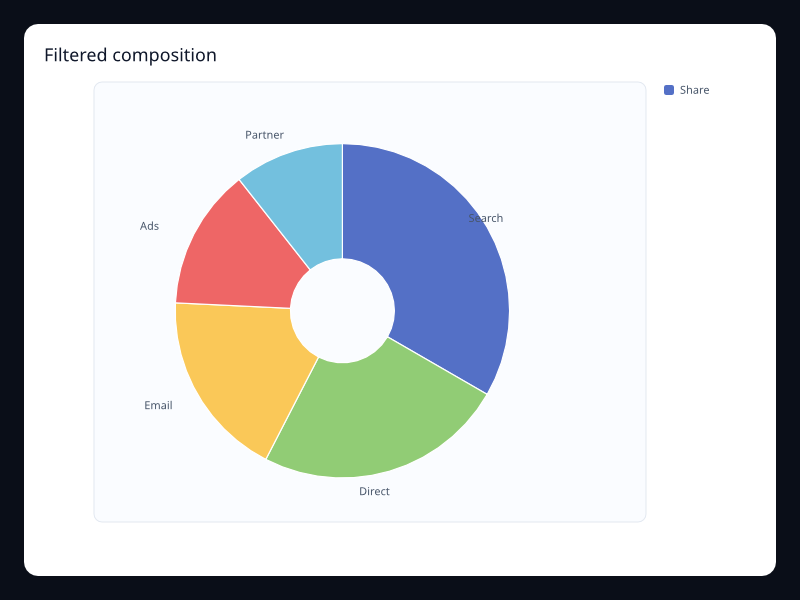
Filtered composition uses Fission Charts typed Rust data to render a production-ready dataset view. Use it when the chart represents a selected dataset slice.
Data: Typed chart data, axes, and series.
Use when: Use it when the chart represents a selected dataset slice
Tags: dataset
Flow dataset sankey
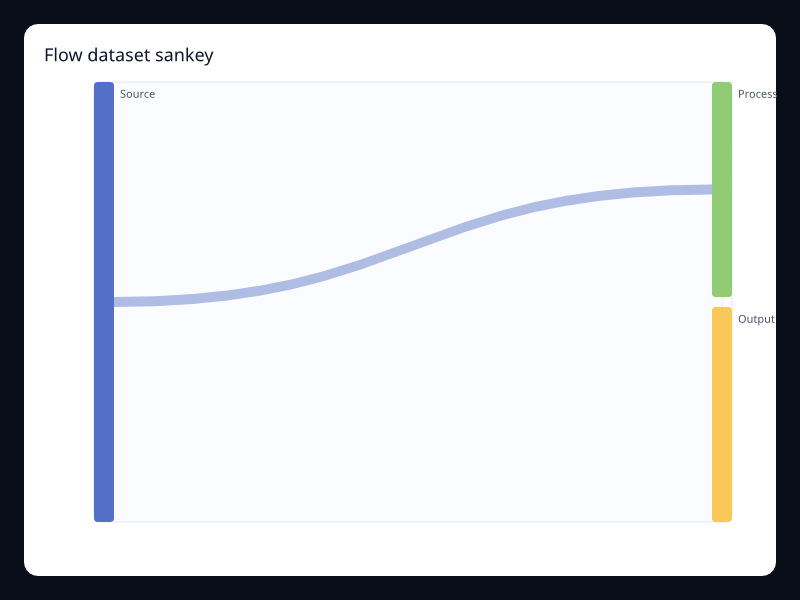
Flow dataset sankey uses Fission Charts typed Rust data to render a production-ready dataset view. Use it when flow data is modeled explicitly.
Data: Typed chart data, axes, and series.
Use when: Use it when flow data is modeled explicitly
Tags: dataset
Coverage dataset map
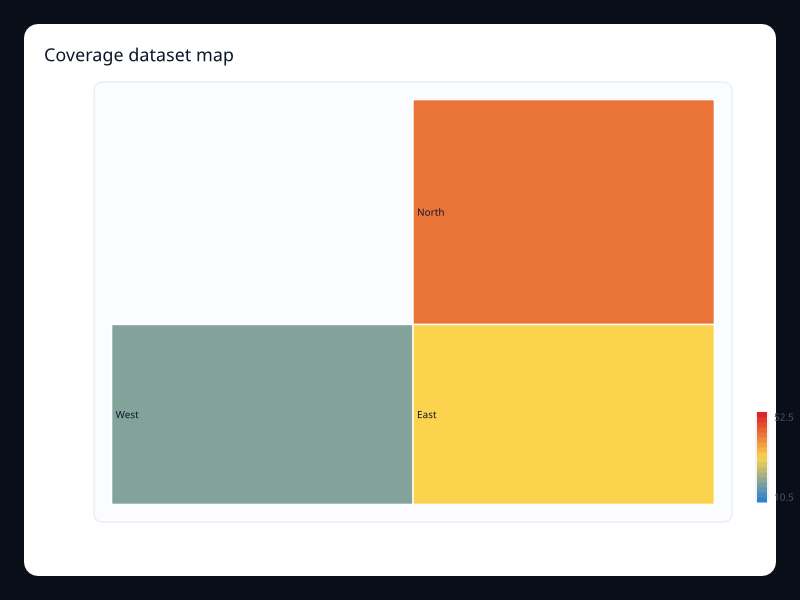
Coverage dataset map uses Fission Charts typed Rust data to render a production-ready dataset view. Use it when geographic views come from named records.
Data: Typed chart data, axes, and series.
Use when: Use it when geographic views come from named records
Tags: dataset
Quality dataset parallel
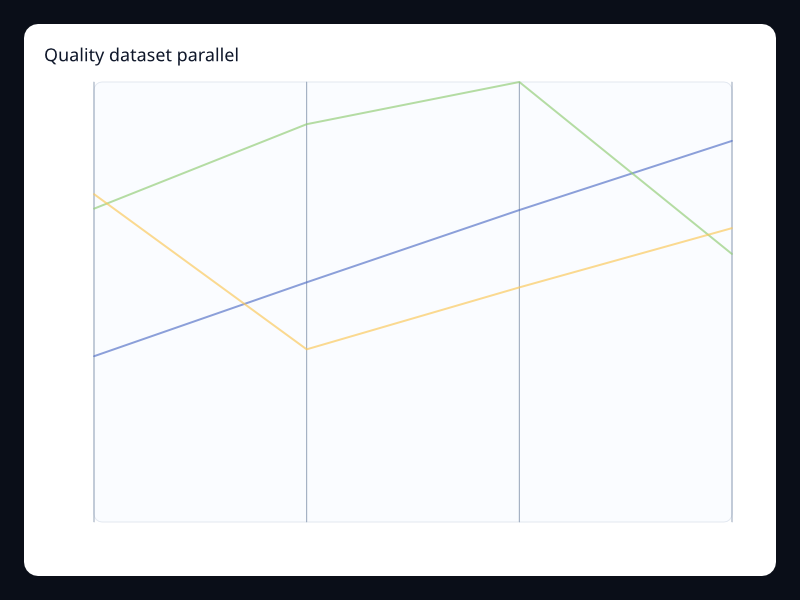
Quality dataset parallel uses Fission Charts typed Rust data to render a production-ready dataset view. Use it when the same table powers multidimensional analysis.
Data: Typed chart data, axes, and series.
Use when: Use it when the same table powers multidimensional analysis
Tags: dataset
Product trend dataset
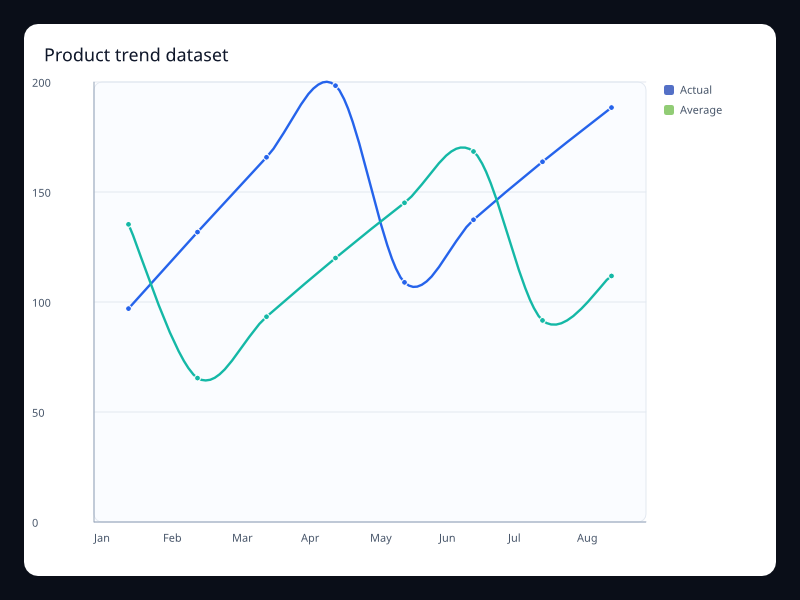
Product trend dataset uses Fission Charts typed Rust data to render a production-ready dataset view. Use it when named fields should drive series values.
Data: Typed chart data, axes, and series.
Use when: Use it when named fields should drive series values
Tags: dataset
Products by year dataset
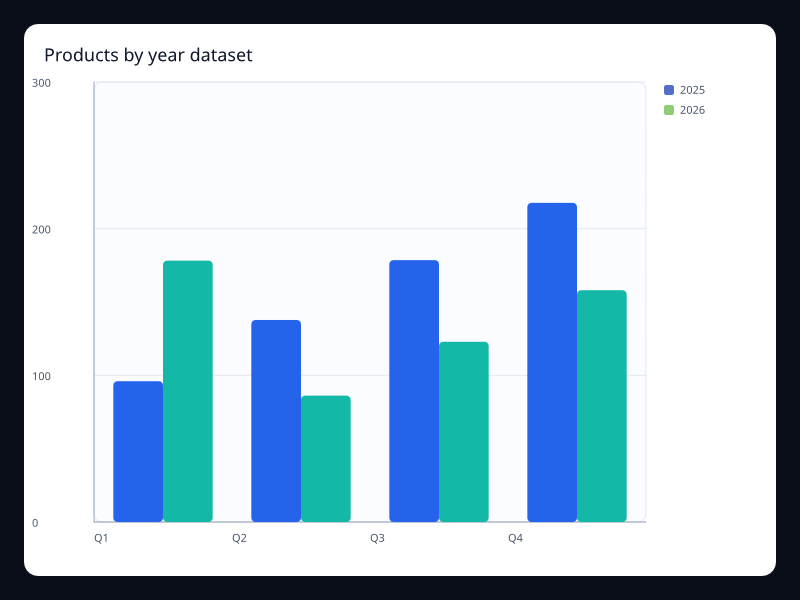
Products by year dataset uses Fission Charts typed Rust data to render a production-ready dataset view. Use it when several chart views should share one dataset.
Data: Typed chart data, axes, and series.
Use when: Use it when several chart views should share one dataset
Tags: dataset
Ranked dataset bars
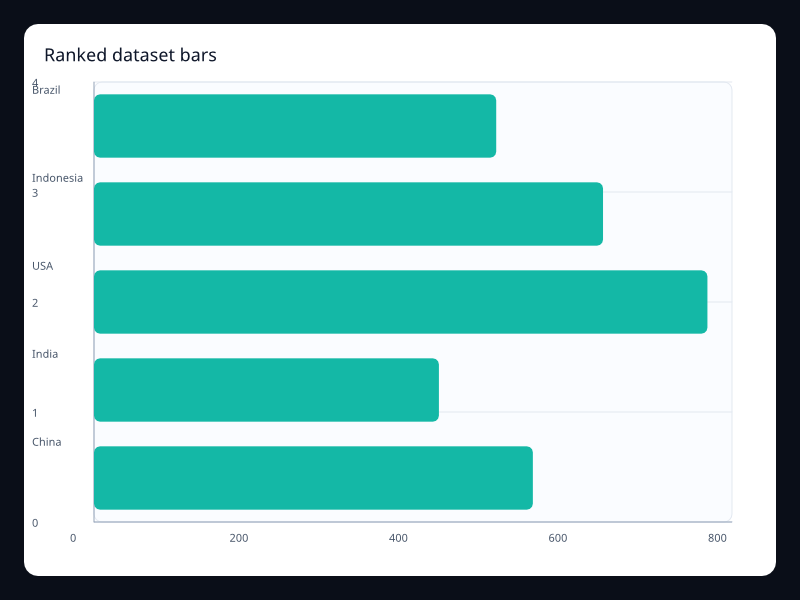
Ranked dataset bars uses Fission Charts typed Rust data to render a production-ready dataset view. Use it when rank comes from data transformation.
Data: Typed chart data, axes, and series.
Use when: Use it when rank comes from data transformation
Tags: dataset
Risk bubbles dataset
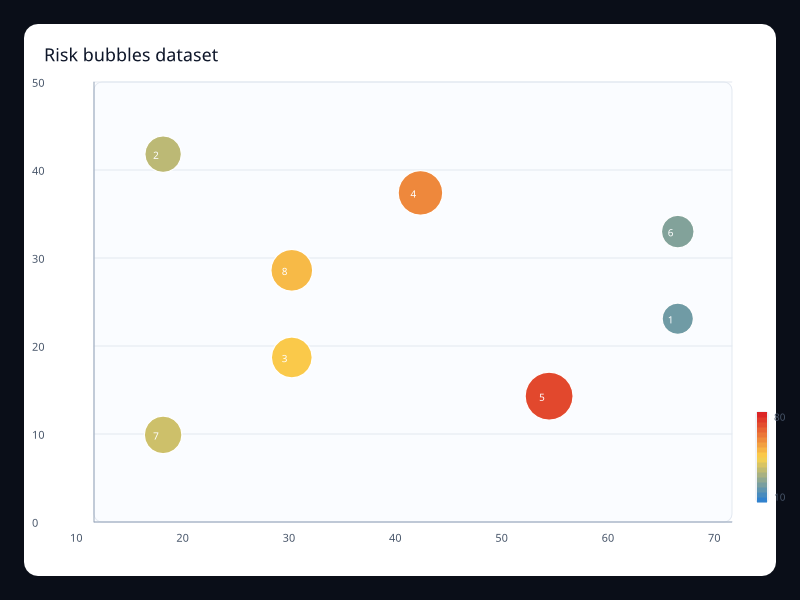
Risk bubbles dataset uses Fission Charts typed Rust data to render a production-ready dataset view. Use it when one table feeds bubble visualization.
Data: Typed chart data, axes, and series.
Use when: Use it when one table feeds bubble visualization
Tags: dataset
Stacked revenue dataset
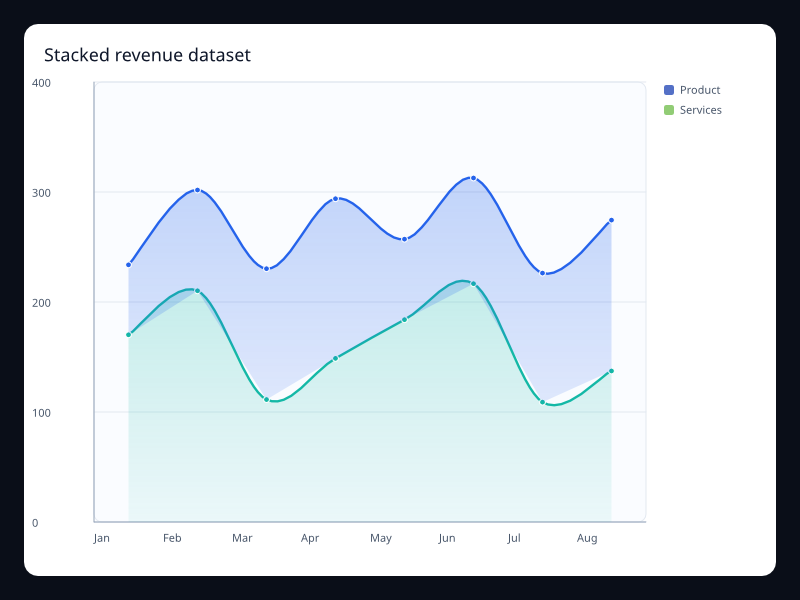
Stacked revenue dataset uses Fission Charts typed Rust data to render a production-ready dataset view. Use it when stack series share the same source table.
Data: Typed chart data, axes, and series.
Use when: Use it when stack series share the same source table
Tags: dataset
Dataset visual heatmap
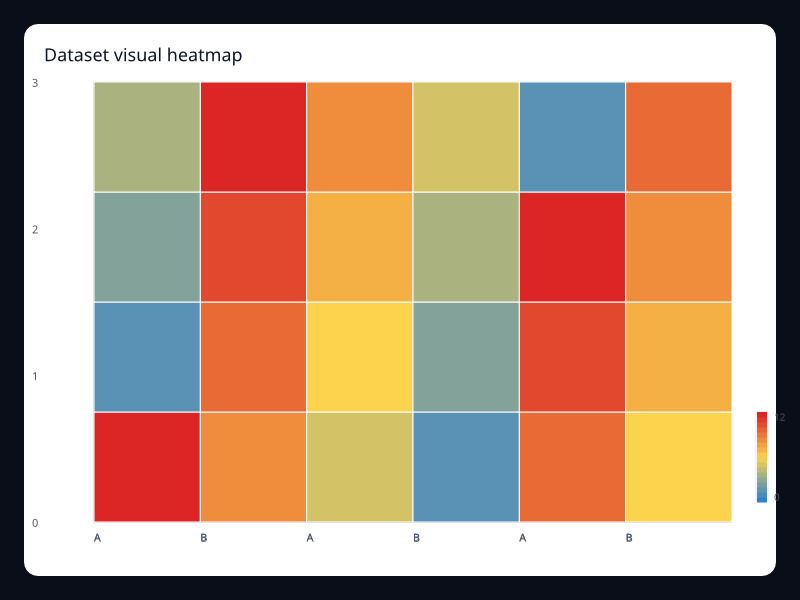
Dataset visual heatmap uses Fission Charts typed Rust data to render a production-ready dataset view. Use it when heatmaps come from generic records.
Data: Typed chart data, axes, and series.
Use when: Use it when heatmaps come from generic records
Tags: dataset
Live alert scatter
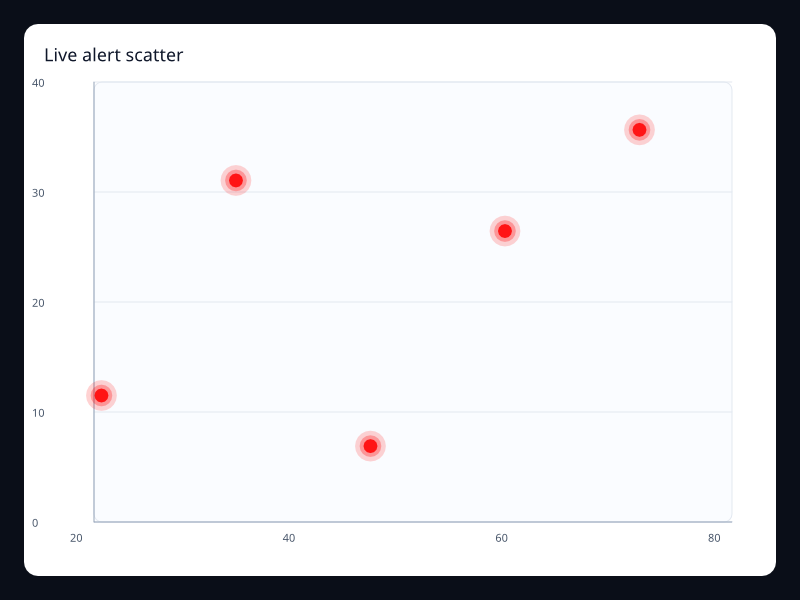
Live alert scatter uses Fission Charts typed Rust data to render a production-ready dataset view. Use it for active events and outliers.
Data: Typed chart data, axes, and series.
Use when: Use it for active events and outliers
Tags: dynamic
Brush telemetry
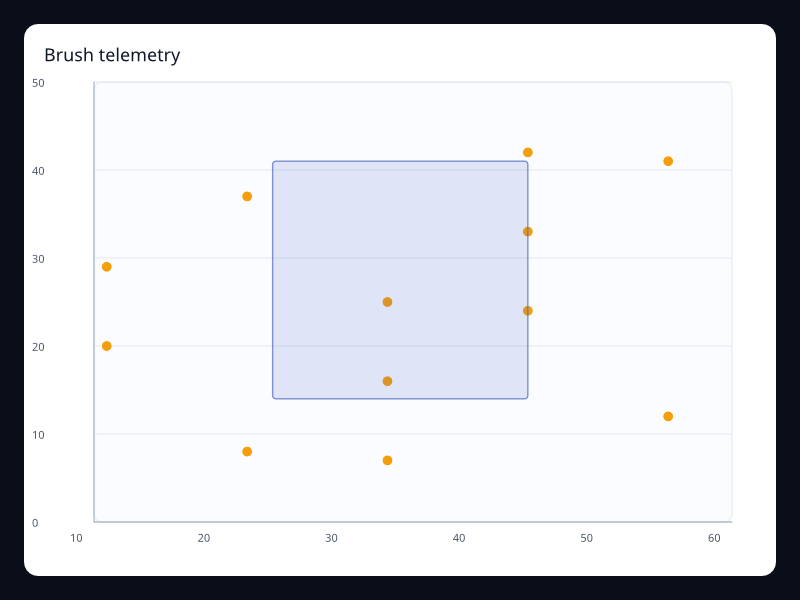
Brush telemetry uses Fission Charts typed Rust data to render a production-ready dataset view. Use it for interactive telemetry exploration.
Data: Typed chart data, axes, and series.
Use when: Use it for interactive telemetry exploration
Tags: dynamic
Live activation funnel
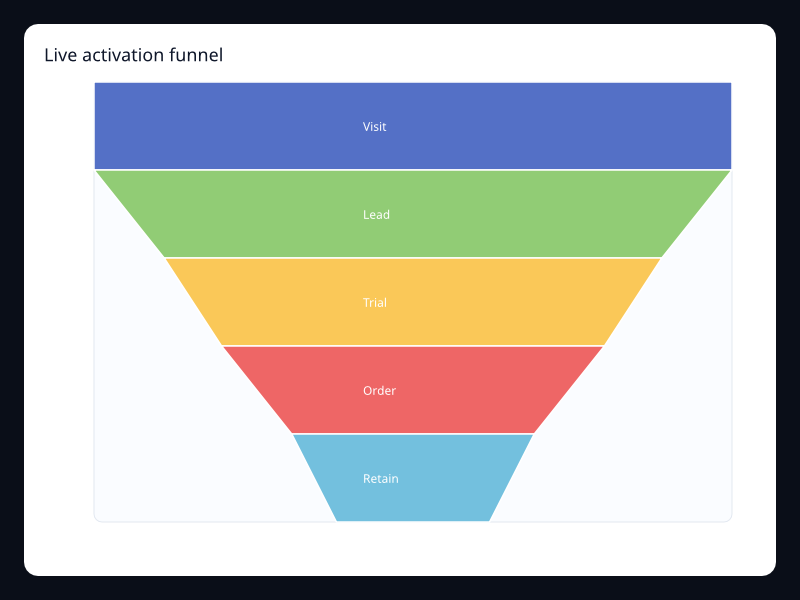
Live activation funnel uses Fission Charts typed Rust data to render a production-ready dataset view. Use it when pipeline stages update during the session.
Data: Typed chart data, axes, and series.
Use when: Use it when pipeline stages update during the session
Tags: dynamic
Live bar update
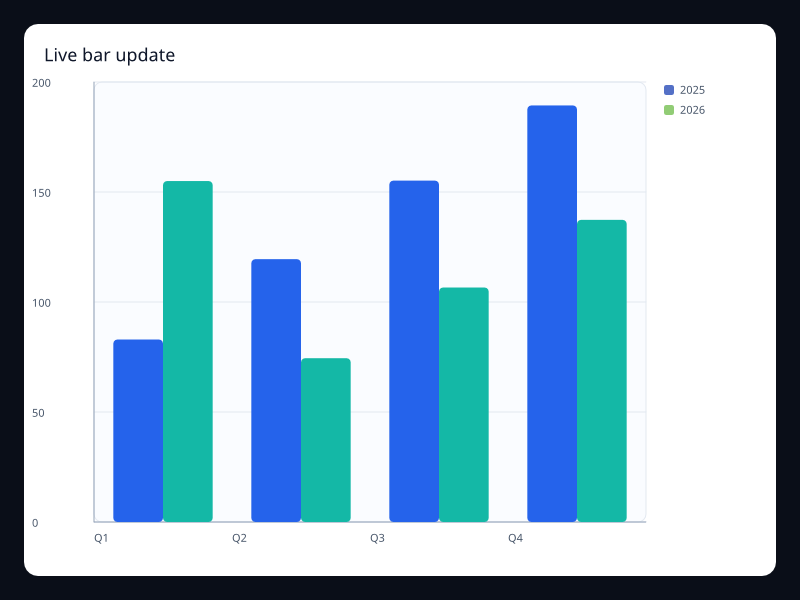
Live bar update uses Fission Charts typed Rust data to render a production-ready dataset view. Use it for updating status summaries.
Data: Typed chart data, axes, and series.
Use when: Use it for updating status summaries
Tags: dynamic
Live line update
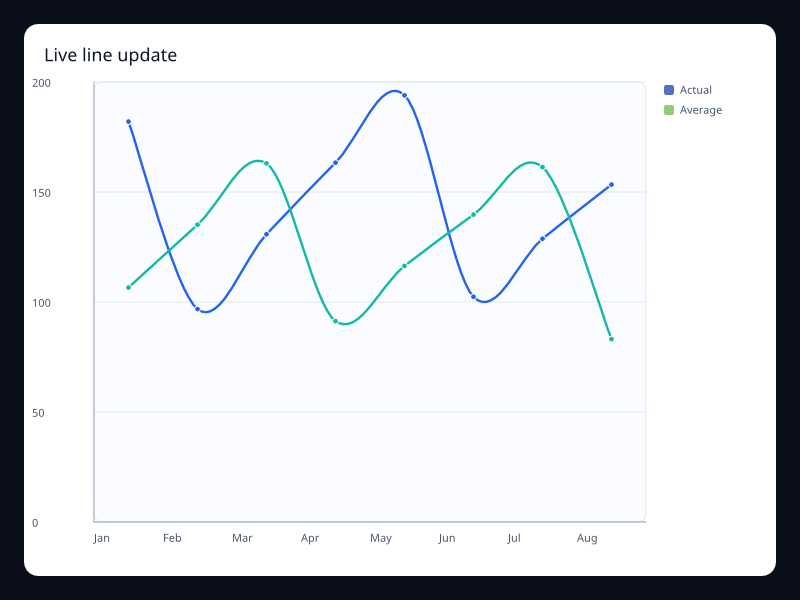
Live line update uses Fission Charts typed Rust data to render a production-ready dataset view. Use it for live monitoring views.
Data: Typed chart data, axes, and series.
Use when: Use it for live monitoring views
Tags: dynamic
Live radar score
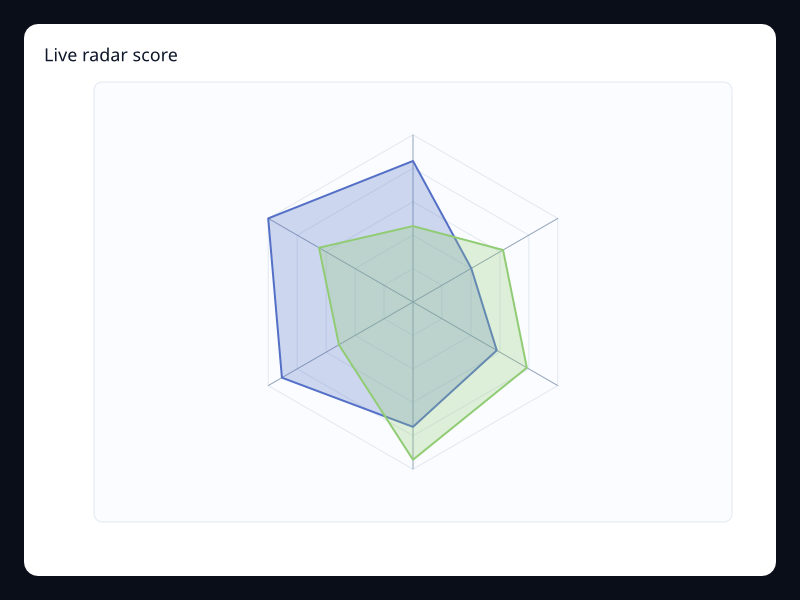
Live radar score uses Fission Charts typed Rust data to render a production-ready dataset view. Use it for live multidimensional scorecards.
Data: Typed chart data, axes, and series.
Use when: Use it for live multidimensional scorecards
Tags: dynamic
Live status gauge
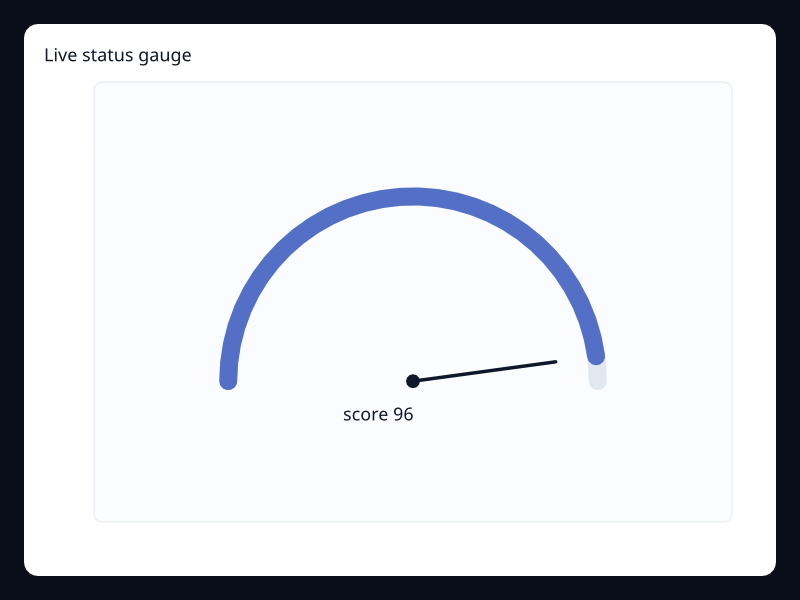
Live status gauge uses Fission Charts typed Rust data to render a production-ready dataset view. Use it when a live number needs a strong visual shape.
Data: Typed chart data, axes, and series.
Use when: Use it when a live number needs a strong visual shape
Tags: dynamic
Quarter timeline
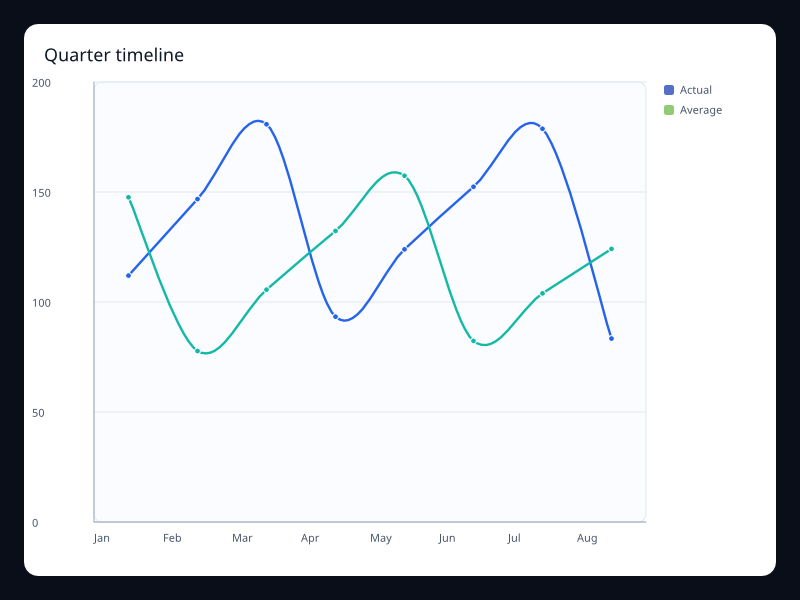
Quarter timeline uses Fission Charts typed Rust data to render a production-ready dataset view. Use it for period-over-period analysis.
Data: Typed chart data, axes, and series.
Use when: Use it for period-over-period analysis
Tags: dynamic
Telemetry toolbox
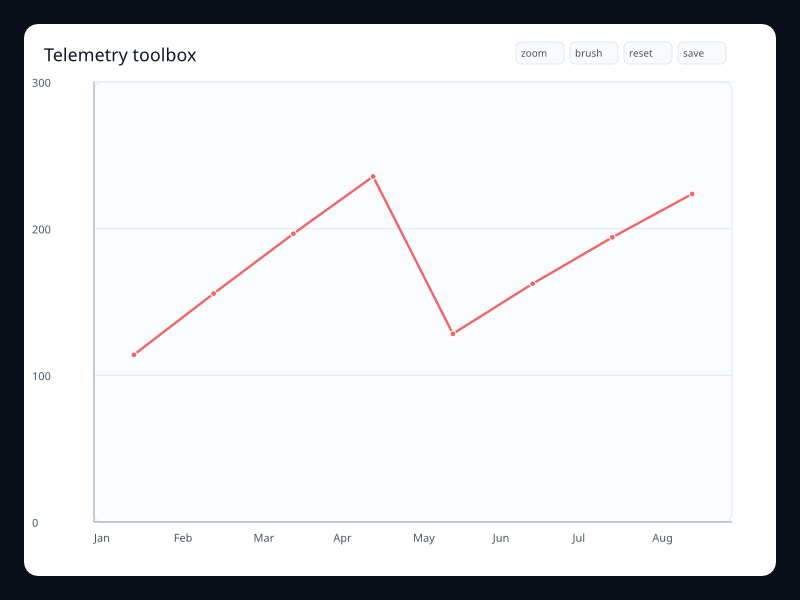
Telemetry toolbox uses Fission Charts typed Rust data to render a production-ready dataset view. Use it when live charts need controlled exploration.
Data: Typed chart data, axes, and series.
Use when: Use it when live charts need controlled exploration
Tags: dynamic
Dataset And Dynamic
Encoded bars dataset
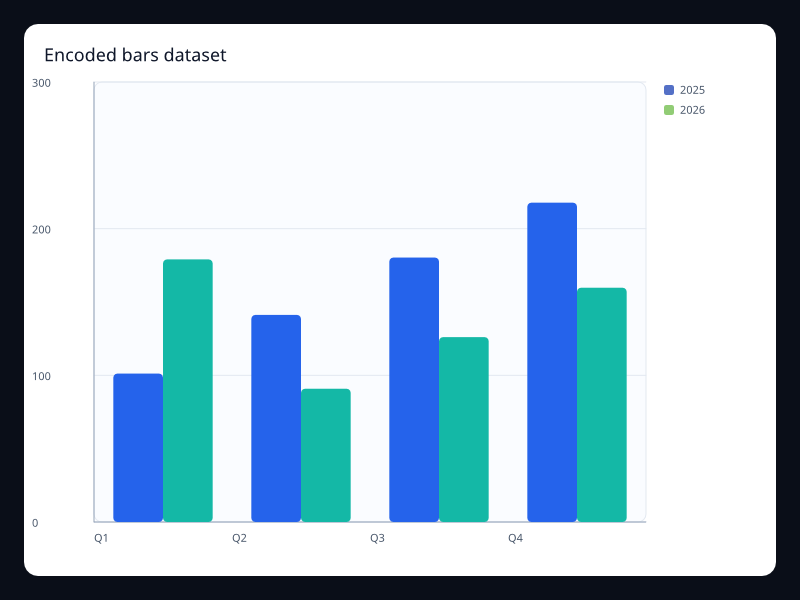
Grouped bars generated from named encoded fields. Use it when chart code should name fields once and reuse them across bar variants.
Data: Typed chart data, axes, and series.
Use when: Use it when chart code should name fields once and reuse them across bar variants
Tags: dataset
Encoded lines dataset
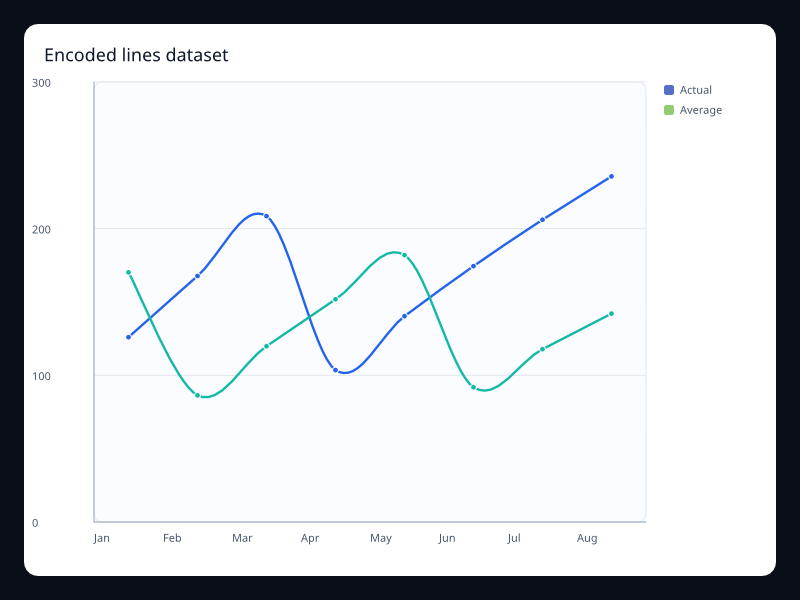
Line series generated from named encoded fields. Use it when the same dataset powers several line views.
Data: Typed chart data, axes, and series.
Use when: Use it when the same dataset powers several line views
Tags: dataset
Dataset stacked area
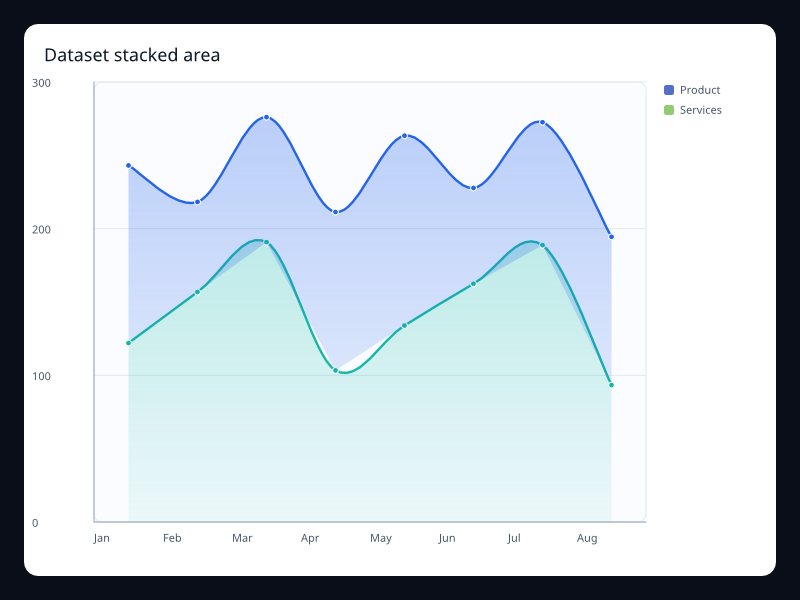
Stacked area view built from reusable dataset-like series. Use it when the data pipeline should stay visible instead of hidden in chart-specific arrays.
Data: Typed chart data, axes, and series.
Use when: Use it when the data pipeline should stay visible instead of hidden in chart-specific arrays
Tags: dataset
Dynamic brush scatter
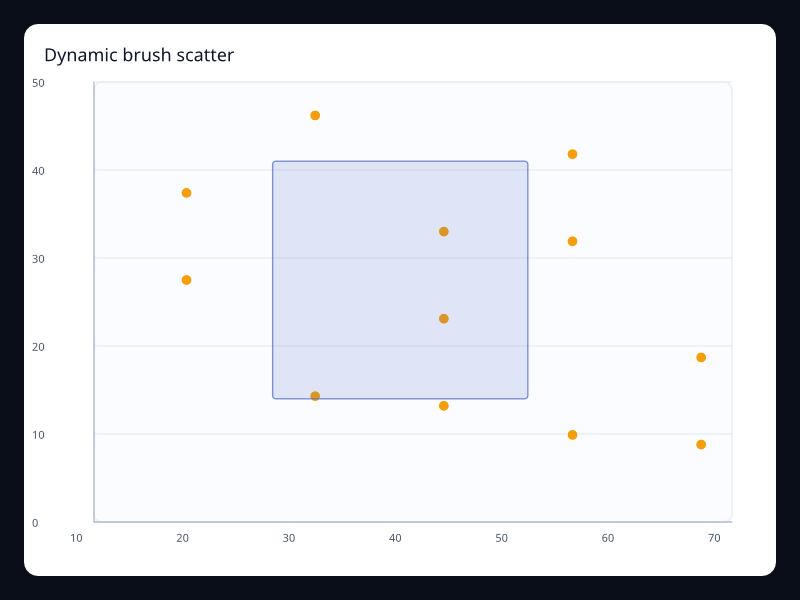
Scatter chart with a visible brush selection preview. Use it when users need to select a region before drilling into data.
Data: Typed chart data, axes, and series.
Use when: Use it when users need to select a region before drilling into data
Tags: dynamic
Dynamic alert scatter
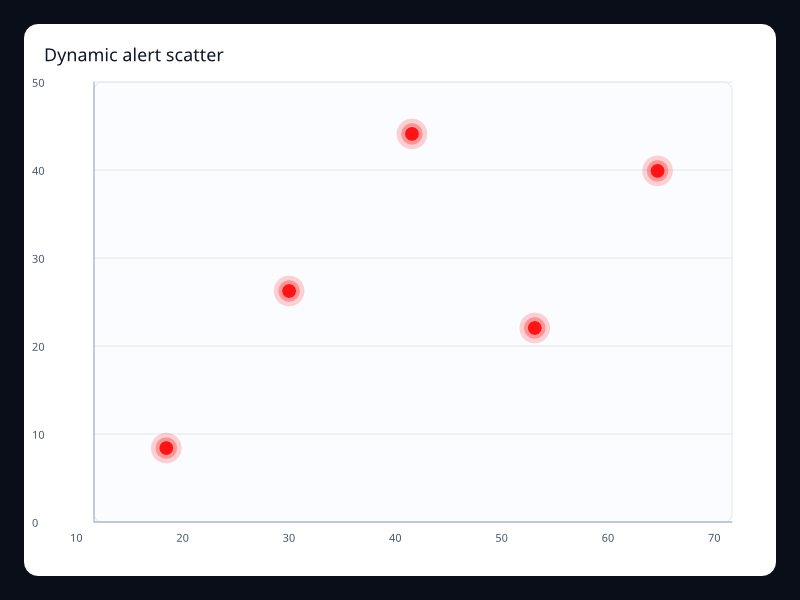
Effect scatter highlighting important points over numeric axes. Use it when outliers or active alerts need immediate attention.
Data: Typed chart data, axes, and series.
Use when: Use it when outliers or active alerts need immediate attention
Tags: dynamic
Dynamic sales funnel
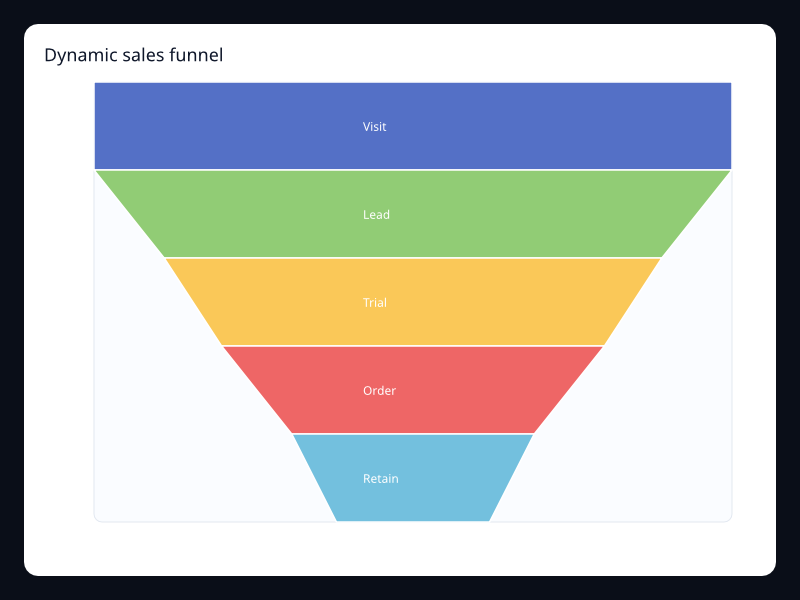
Funnel showing staged conversion through a pipeline. Use it when the loss between stages matters more than exact axis measurement.
Data: Typed chart data, axes, and series.
Use when: Use it when the loss between stages matters more than exact axis measurement
Tags: dynamic
Dynamic score gauge
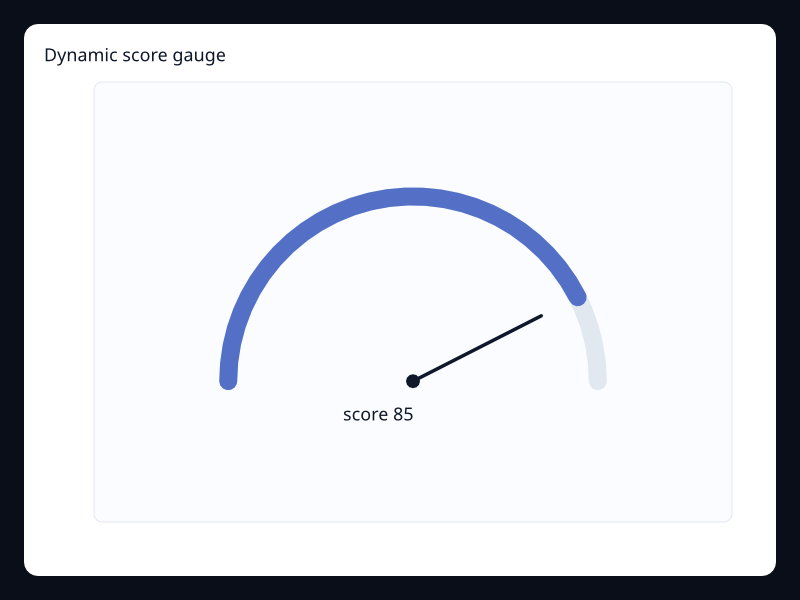
Gauge configured for a score or quality metric. Use it for scorecards where the main result should be immediately visible.
Data: Typed chart data, axes, and series.
Use when: Use it for scorecards where the main result should be immediately visible
Tags: dynamic
Dynamic speed gauge
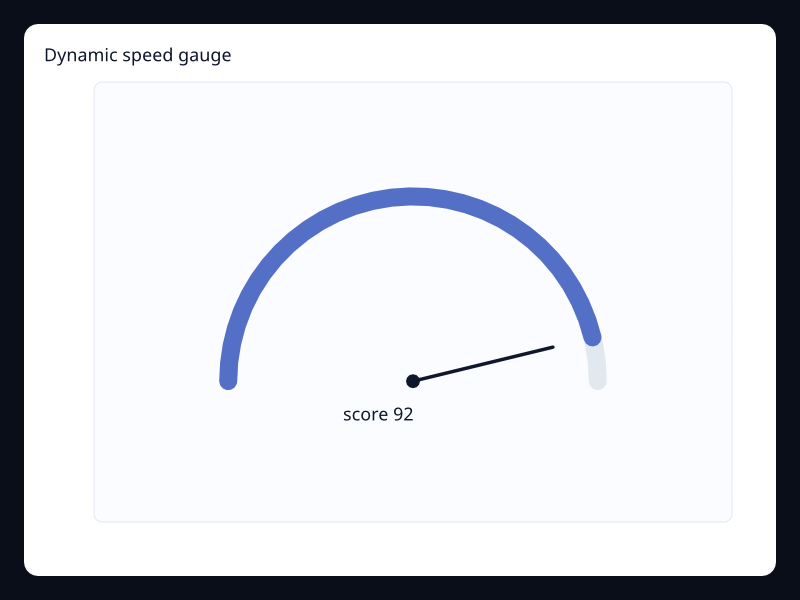
Gauge configured for a changing bounded measure. Use it for operational status values where one number dominates the view.
Data: Typed chart data, axes, and series.
Use when: Use it for operational status values where one number dominates the view
Tags: dynamic
Dynamic pictorial units
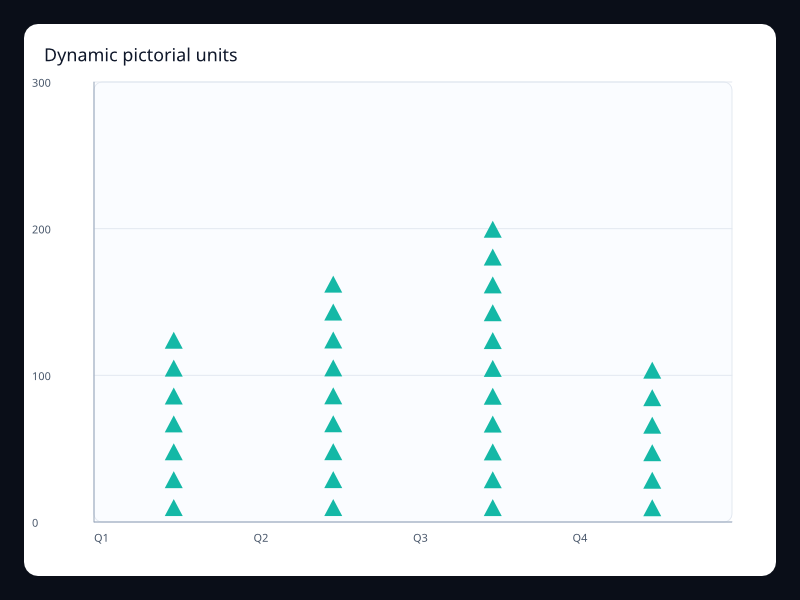
Pictorial bar using symbolic marks for count-like values. Use it for unit counts that benefit from a branded or icon-like visual form.
Data: Typed chart data, axes, and series.
Use when: Use it for unit counts that benefit from a branded or icon-like visual form
Tags: dynamic
Dynamic polar score
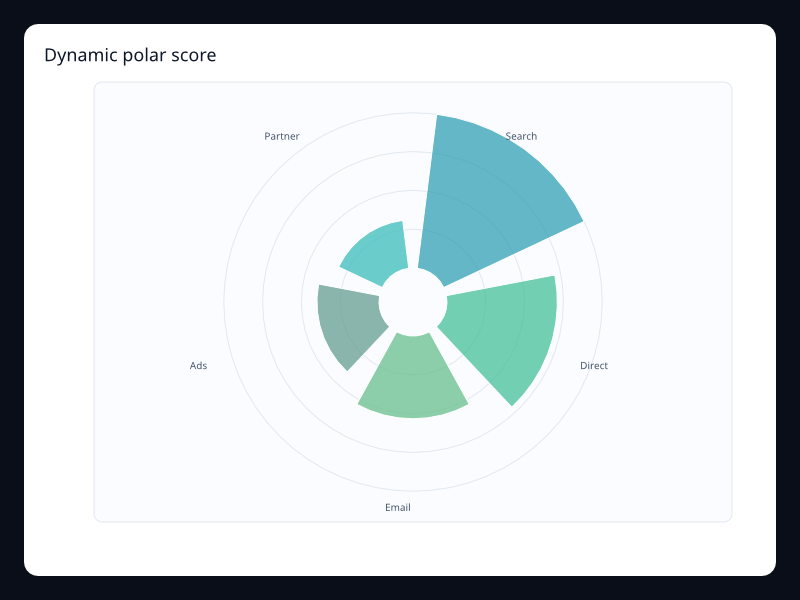
Polar bars arranged around a radial scale. Use it for cyclic or radial score comparisons.
Data: Typed chart data, axes, and series.
Use when: Use it for cyclic or radial score comparisons
Tags: dynamic
Dynamic radar health
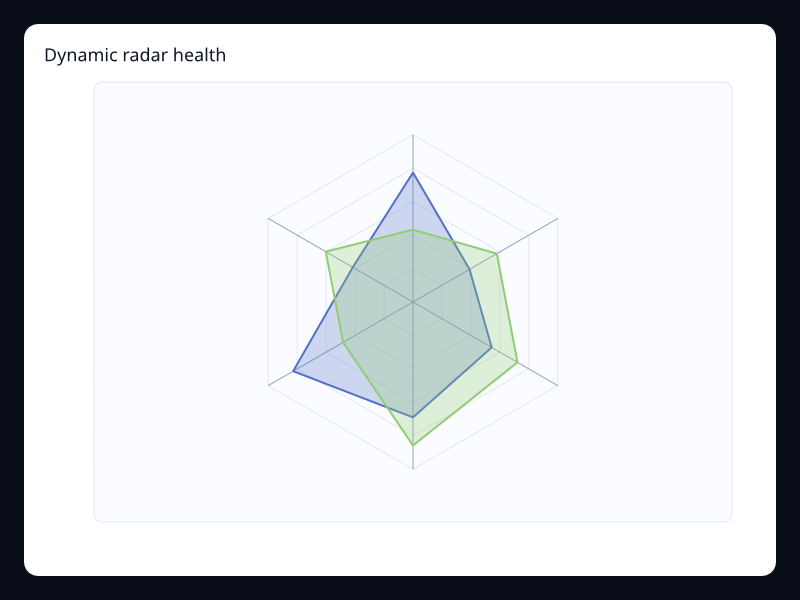
Radar profile with multiple dimensions on one shape. Use it for multidimensional status summaries.
Data: Typed chart data, axes, and series.
Use when: Use it for multidimensional status summaries
Tags: dynamic
Dynamic single-axis events
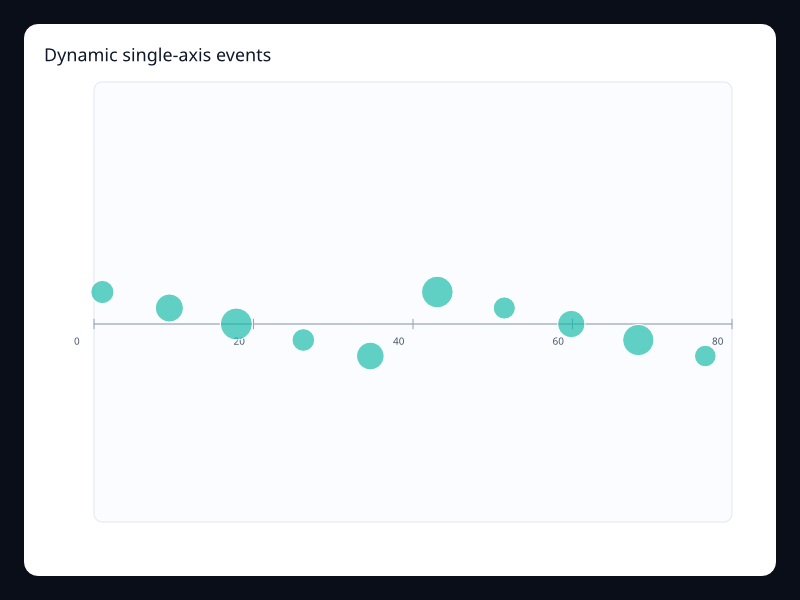
Single-axis event distribution with value-coded marks. Use it for timelines or compact event strips.
Data: Typed chart data, axes, and series.
Use when: Use it for timelines or compact event strips
Tags: dynamic
Dynamic toolbox line
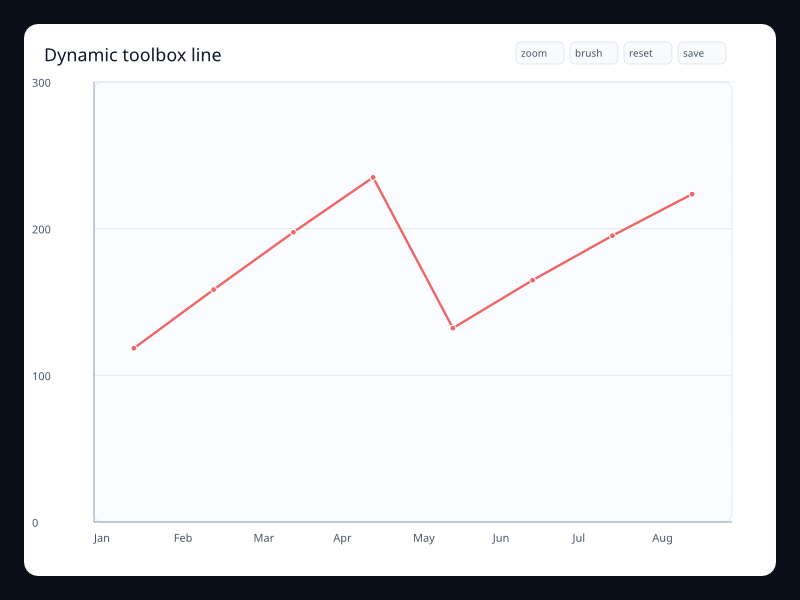
Line chart with explicit chart utility actions. Use it when zoom, brush, restore, and export controls belong with the chart.
Data: Typed chart data, axes, and series.
Use when: Use it when zoom, brush, restore, and export controls belong with the chart
Tags: dynamic
Visual map calendar
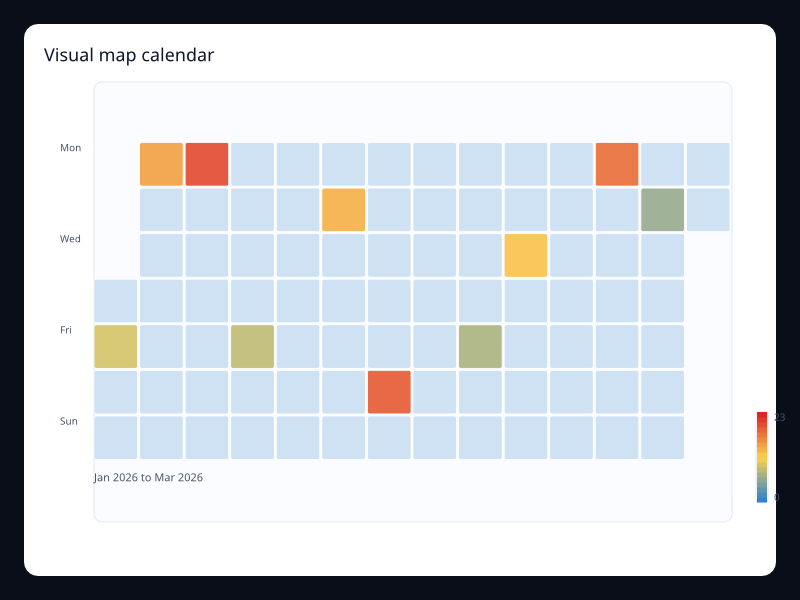
Calendar heatmap with a continuous value scale. Use it to show daily volume, incidents, or activity in a compact year-like shape.
Data: Typed chart data, axes, and series.
Use when: Use it to show daily volume, incidents, or activity in a compact year-like shape
Tags: visualMap
Visual map heatmap
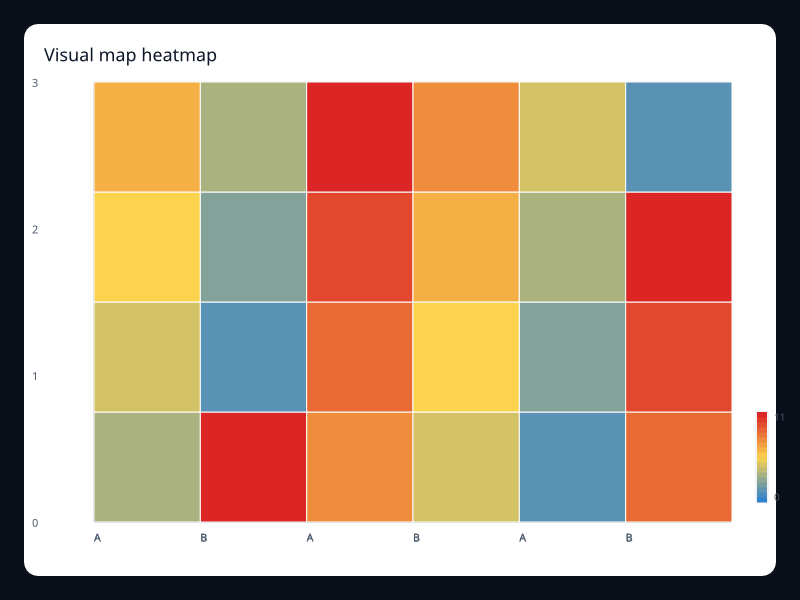
Heatmap with a continuous value scale. Use it for dense comparisons where color communicates rank faster than labels.
Data: Typed chart data, axes, and series.
Use when: Use it for dense comparisons where color communicates rank faster than labels
Tags: visualMap
Visual map scatter
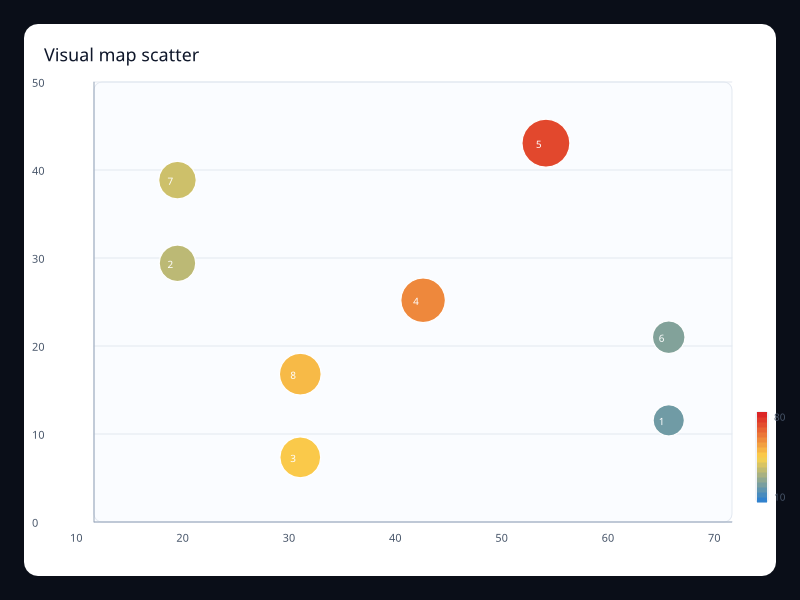
Bubble scatter with value-driven size and color scale. Use it when density and magnitude both matter.
Data: Typed chart data, axes, and series.
Use when: Use it when density and magnitude both matter
Tags: visualMap
Geo
Data center links
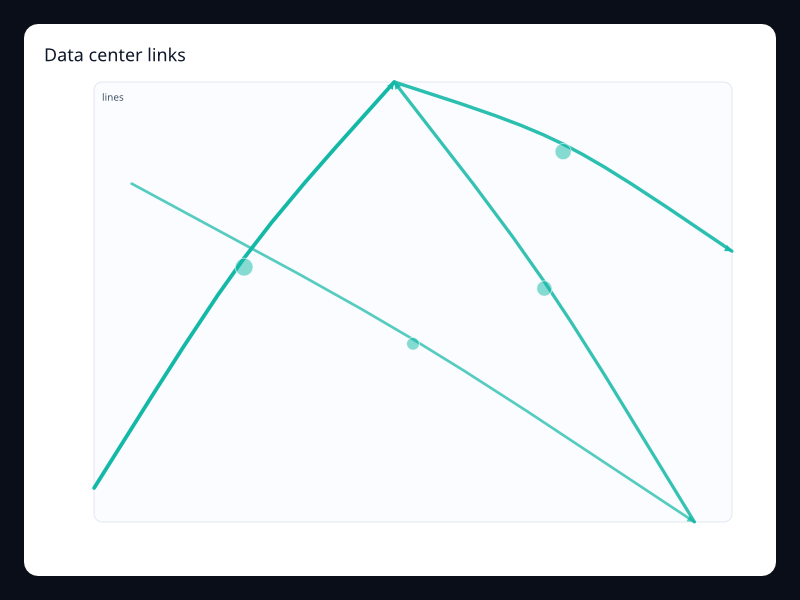
Data center links uses Fission Charts typed Rust data to render a production-ready geo view. Use it for infrastructure network views.
Data: Typed chart data, axes, and series.
Use when: Use it for infrastructure network views
Tags: geo
Dispatch routes
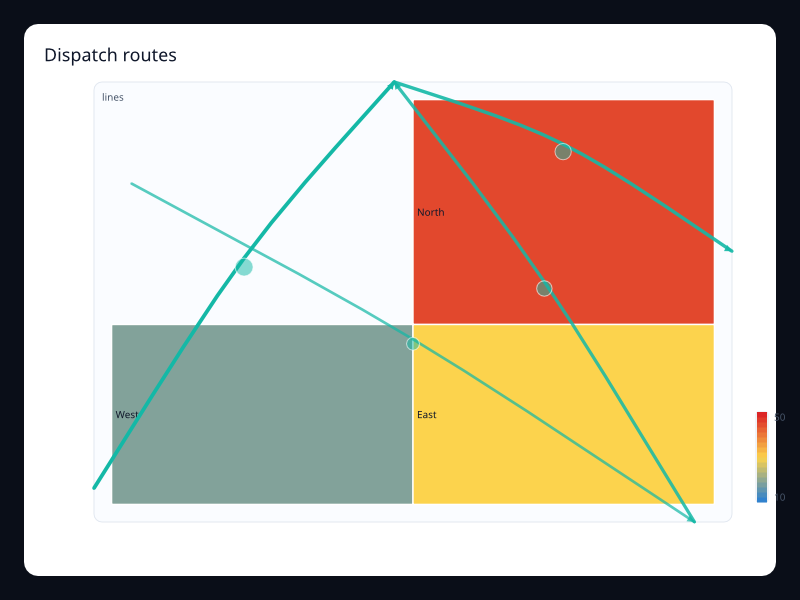
Dispatch routes uses Fission Charts typed Rust data to render a production-ready geo view. Use it when routes need region context.
Data: Typed chart data, axes, and series.
Use when: Use it when routes need region context
Tags: map
Migration flow
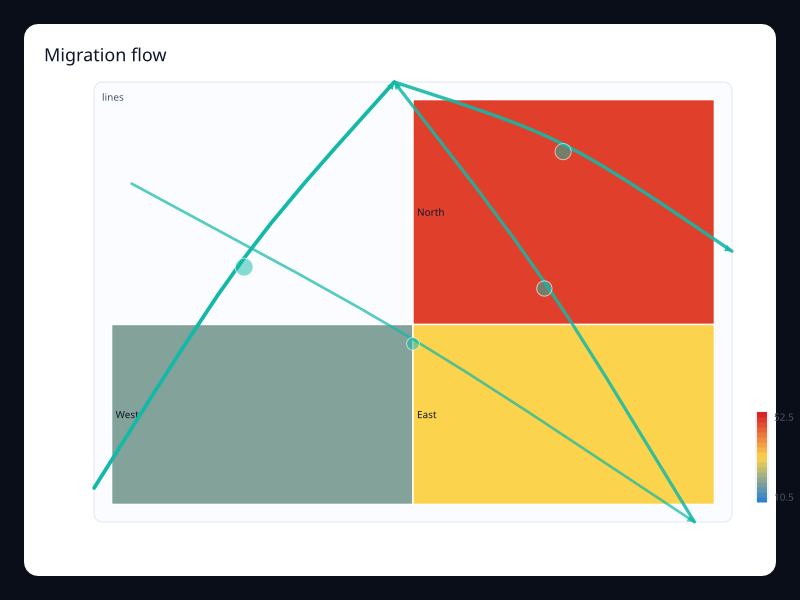
Migration flow uses Fission Charts typed Rust data to render a production-ready geo view. Use it for source-to-destination stories.
Data: Typed chart data, axes, and series.
Use when: Use it for source-to-destination stories
Tags: geo
Network overlay
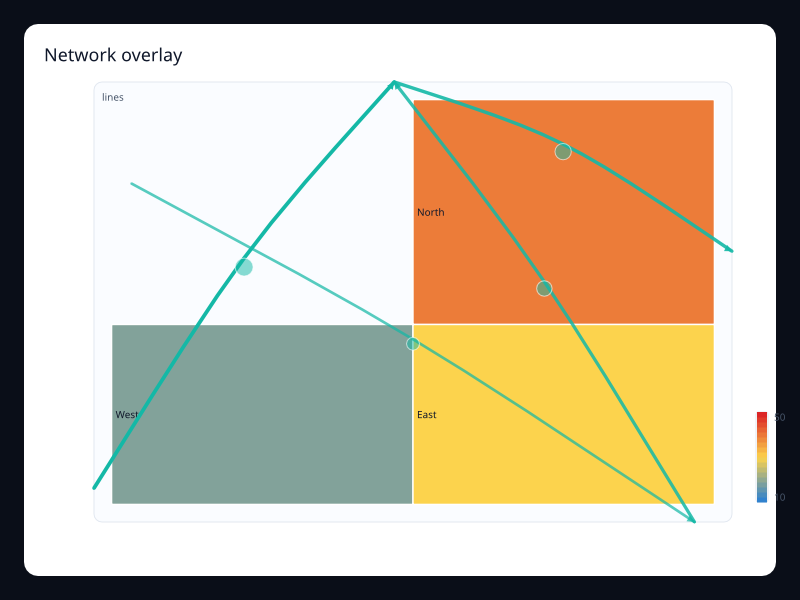
Network overlay uses Fission Charts typed Rust data to render a production-ready geo view. Use it for linked geographic systems.
Data: Typed chart data, axes, and series.
Use when: Use it for linked geographic systems
Tags: geo
Route overlay map
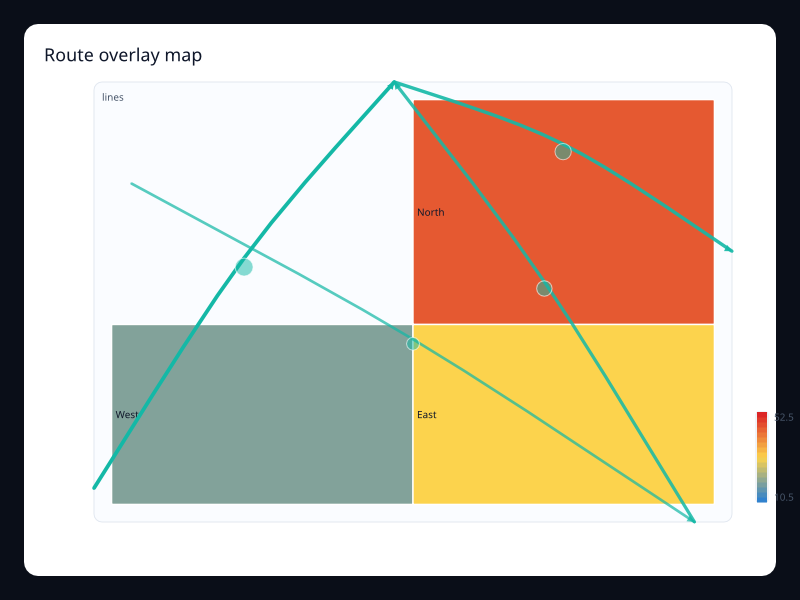
Route overlay map uses Fission Charts typed Rust data to render a production-ready geo view. Use it when geography and movement are inseparable.
Data: Typed chart data, axes, and series.
Use when: Use it when geography and movement are inseparable
Tags: map
Sales route map
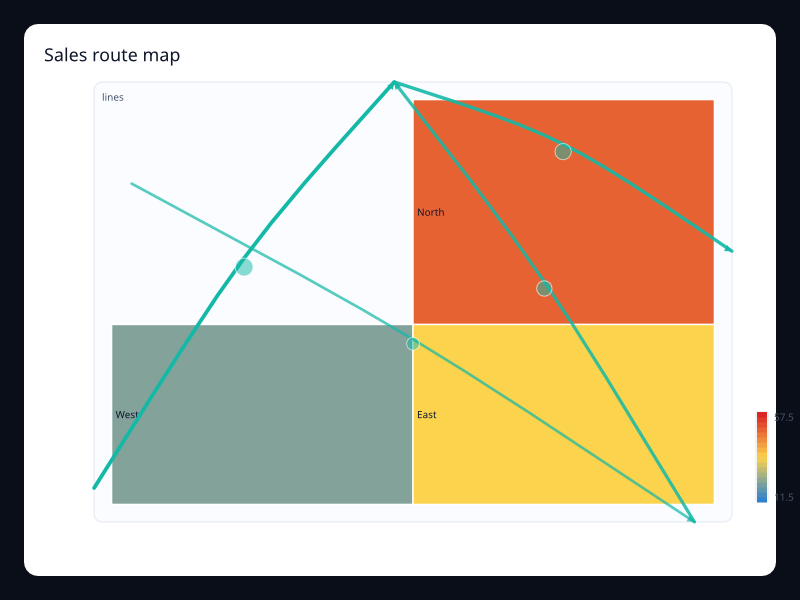
Sales route map uses Fission Charts typed Rust data to render a production-ready geo view. Use it for field team planning.
Data: Typed chart data, axes, and series.
Use when: Use it for field team planning
Tags: geo
Courier routes
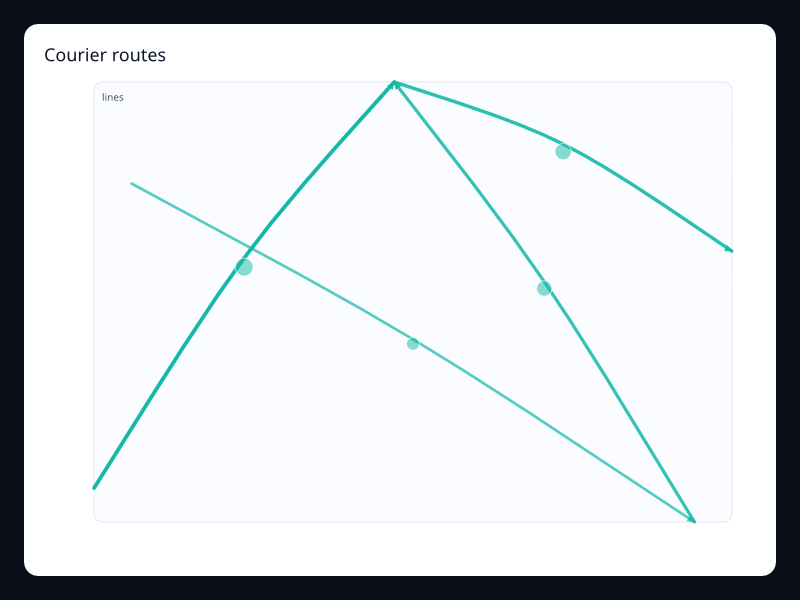
Courier routes uses Fission Charts typed Rust data to render a production-ready geo view. Use it for logistics routing.
Data: Typed chart data, axes, and series.
Use when: Use it for logistics routing
Tags: lines
Flight density lines
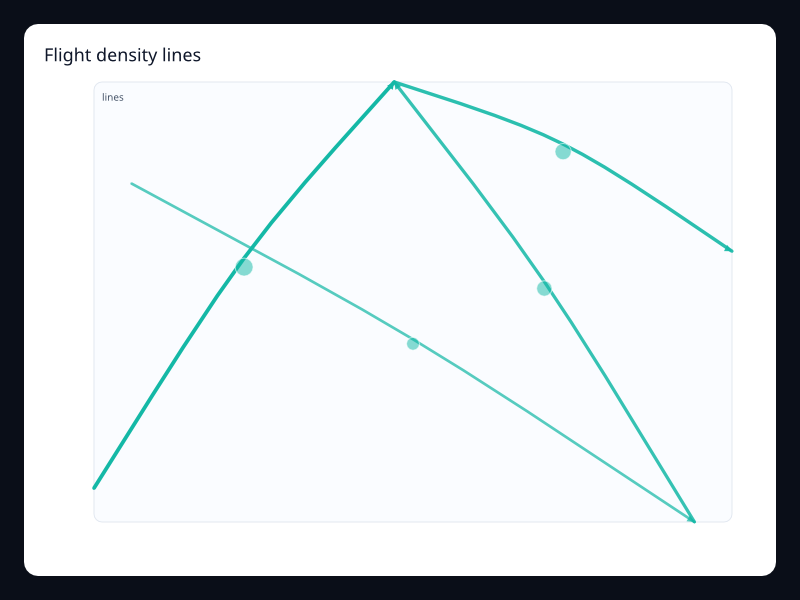
Flight density lines uses Fission Charts typed Rust data to render a production-ready geo view. Use it for movement patterns.
Data: Typed chart data, axes, and series.
Use when: Use it for movement patterns
Tags: lines
Incident routing lines
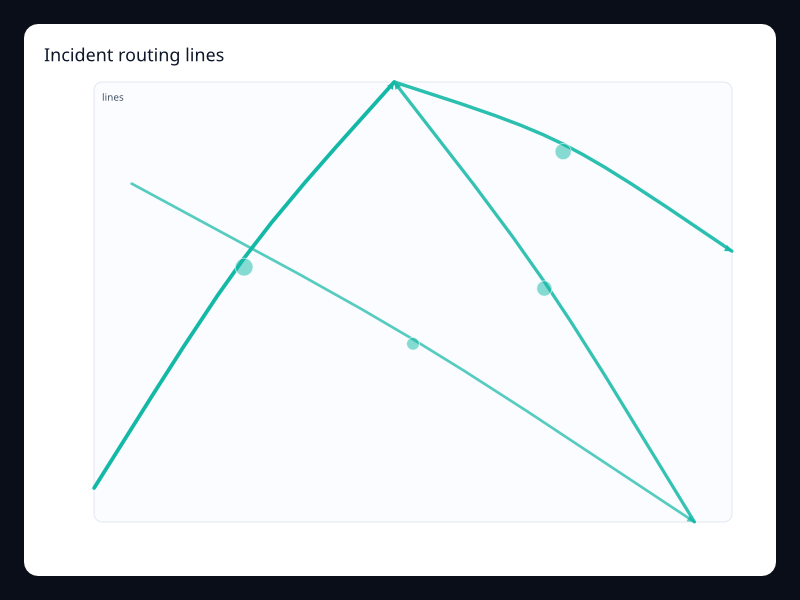
Incident routing lines uses Fission Charts typed Rust data to render a production-ready geo view. Use it for dispatch and response analytics.
Data: Typed chart data, axes, and series.
Use when: Use it for dispatch and response analytics
Tags: lines
Network traffic lines
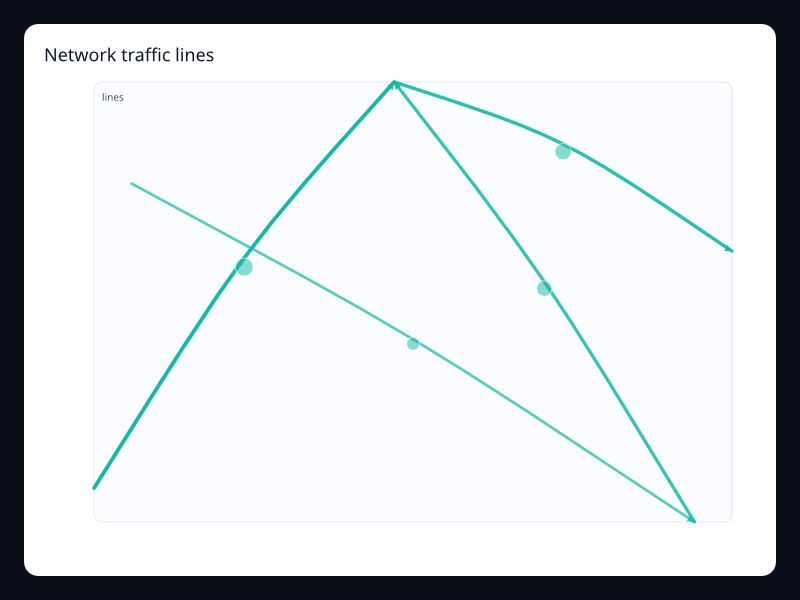
Network traffic lines uses Fission Charts typed Rust data to render a production-ready geo view. Use it for flow over a spatial surface.
Data: Typed chart data, axes, and series.
Use when: Use it for flow over a spatial surface
Tags: lines
Supply routes
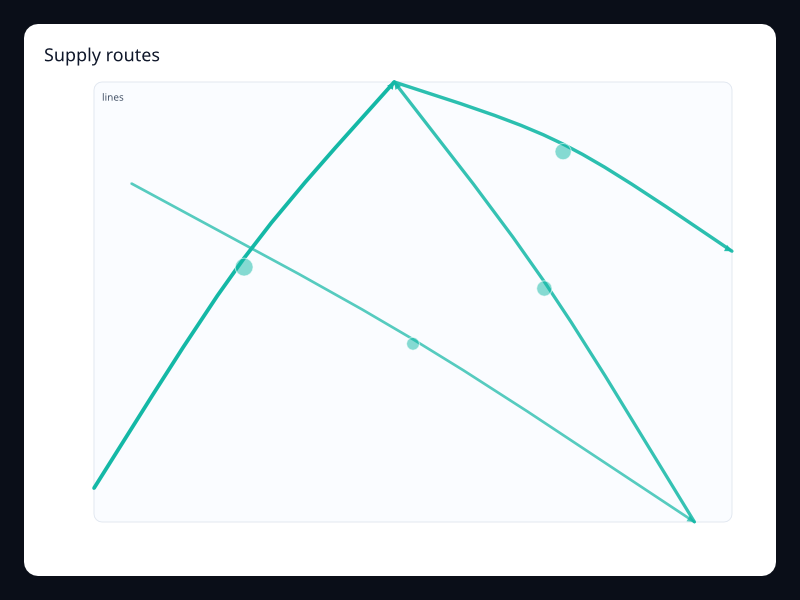
Supply routes uses Fission Charts typed Rust data to render a production-ready geo view. Use it for route and movement diagrams.
Data: Typed chart data, axes, and series.
Use when: Use it for route and movement diagrams
Tags: lines
Capacity regions map
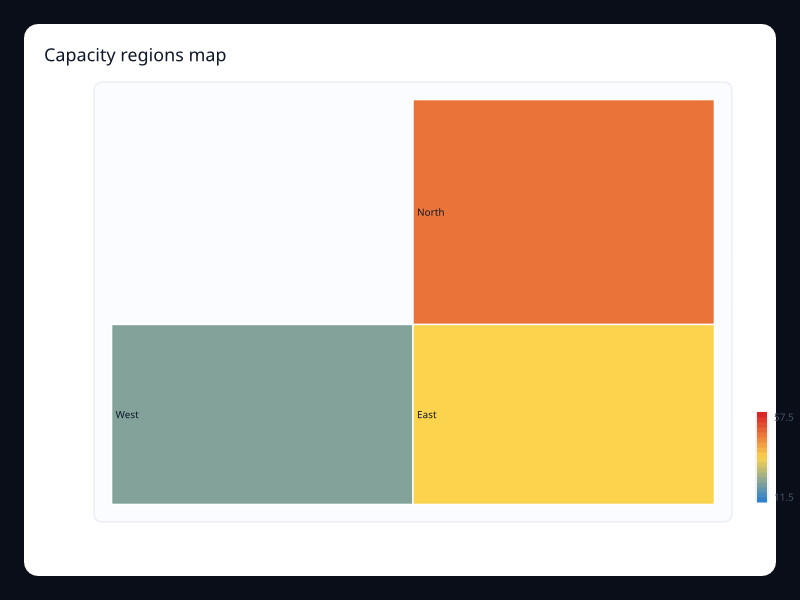
Capacity regions map uses Fission Charts typed Rust data to render a production-ready geo view. Use it for capacity by geography.
Data: Typed chart data, axes, and series.
Use when: Use it for capacity by geography
Tags: map
Coverage score map
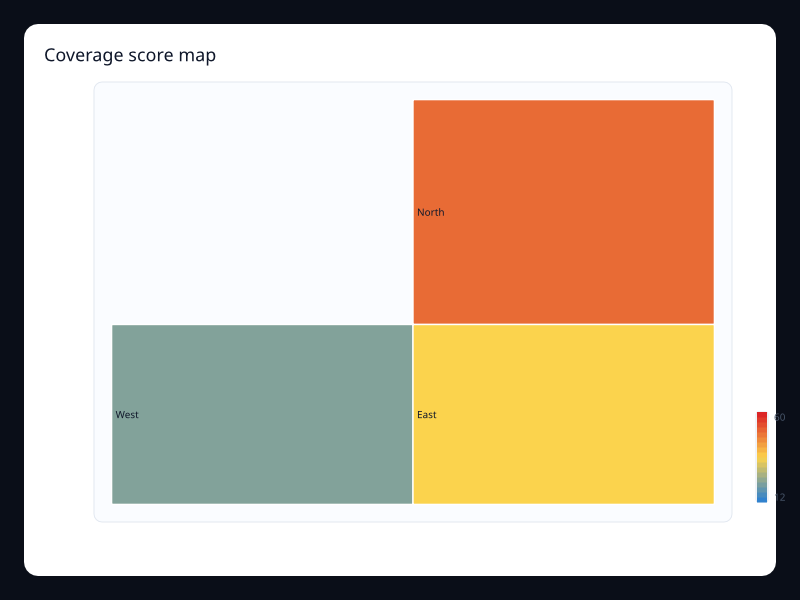
Coverage score map uses Fission Charts typed Rust data to render a production-ready geo view. Use it for service coverage surfaces.
Data: Typed chart data, axes, and series.
Use when: Use it for service coverage surfaces
Tags: map
Expansion plan map
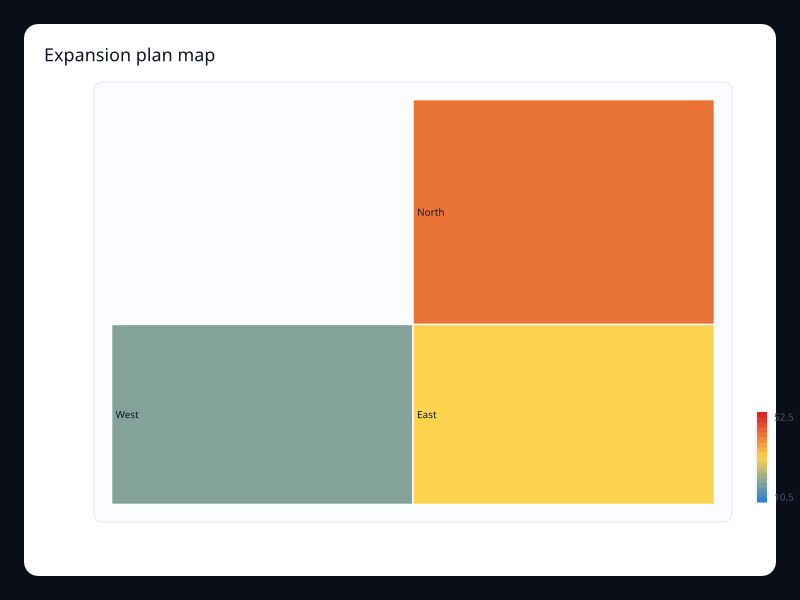
Expansion plan map uses Fission Charts typed Rust data to render a production-ready geo view. Use it for geographic planning dashboards.
Data: Typed chart data, axes, and series.
Use when: Use it for geographic planning dashboards
Tags: map
Incident severity map
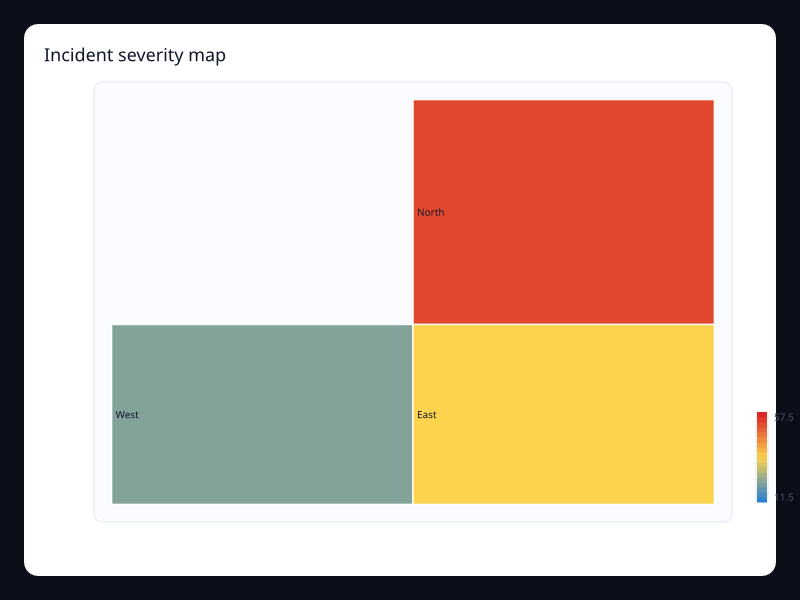
Incident severity map uses Fission Charts typed Rust data to render a production-ready geo view. Use it for incident command views.
Data: Typed chart data, axes, and series.
Use when: Use it for incident command views
Tags: map
Market regions map
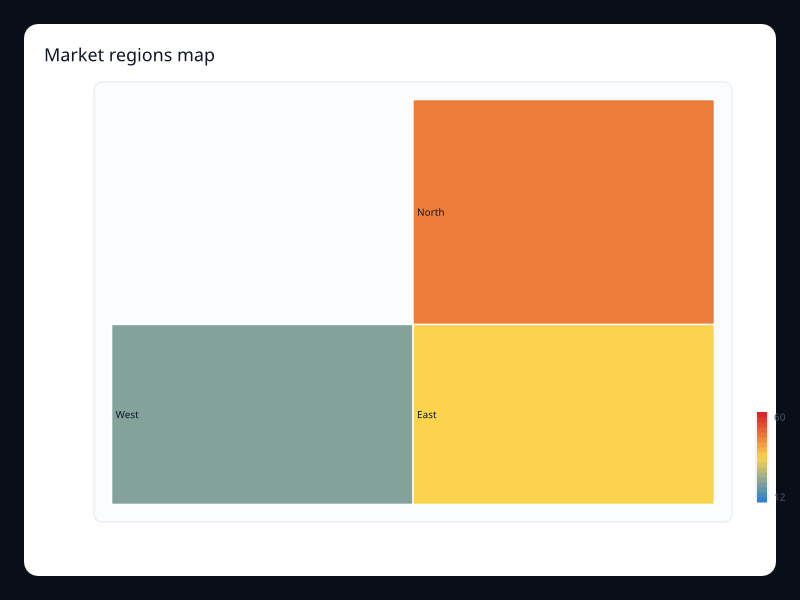
Market regions map uses Fission Charts typed Rust data to render a production-ready geo view. Use it for regional comparisons where shape matters.
Data: Typed chart data, axes, and series.
Use when: Use it for regional comparisons where shape matters
Tags: map
Risk regions map
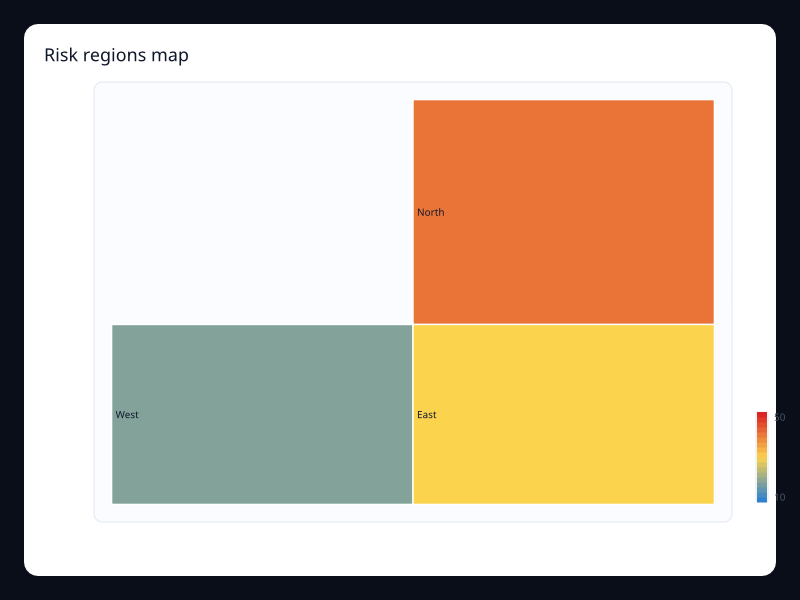
Risk regions map uses Fission Charts typed Rust data to render a production-ready geo view. Use it to scan geographic risk.
Data: Typed chart data, axes, and series.
Use when: Use it to scan geographic risk
Tags: map
Sales territory map
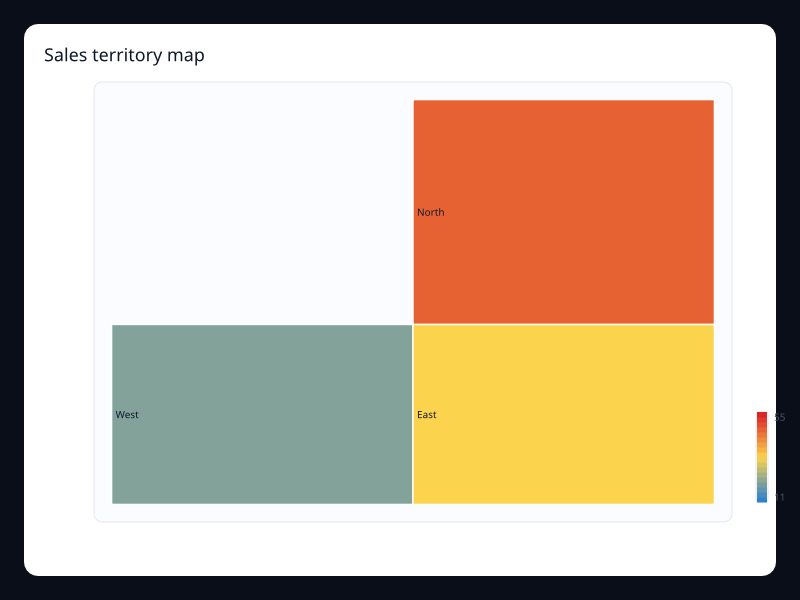
Sales territory map uses Fission Charts typed Rust data to render a production-ready geo view. Use it when territory is the mental model.
Data: Typed chart data, axes, and series.
Use when: Use it when territory is the mental model
Tags: map
Service health map
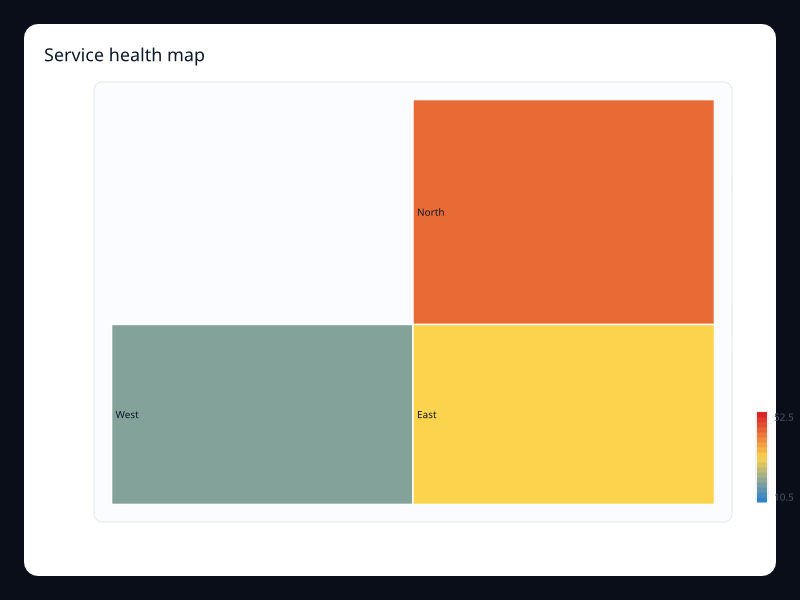
Service health map uses Fission Charts typed Rust data to render a production-ready geo view. Use it for operational geography.
Data: Typed chart data, axes, and series.
Use when: Use it for operational geography
Tags: map
Support demand map
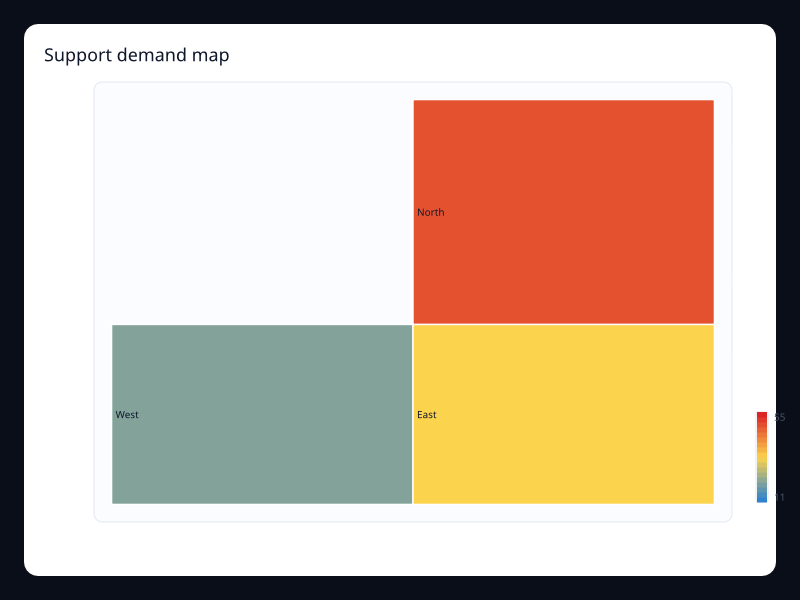
Support demand map uses Fission Charts typed Rust data to render a production-ready geo view. Use it to allocate support capacity geographically.
Data: Typed chart data, axes, and series.
Use when: Use it to allocate support capacity geographically
Tags: map
Geo And Route
Migration routes
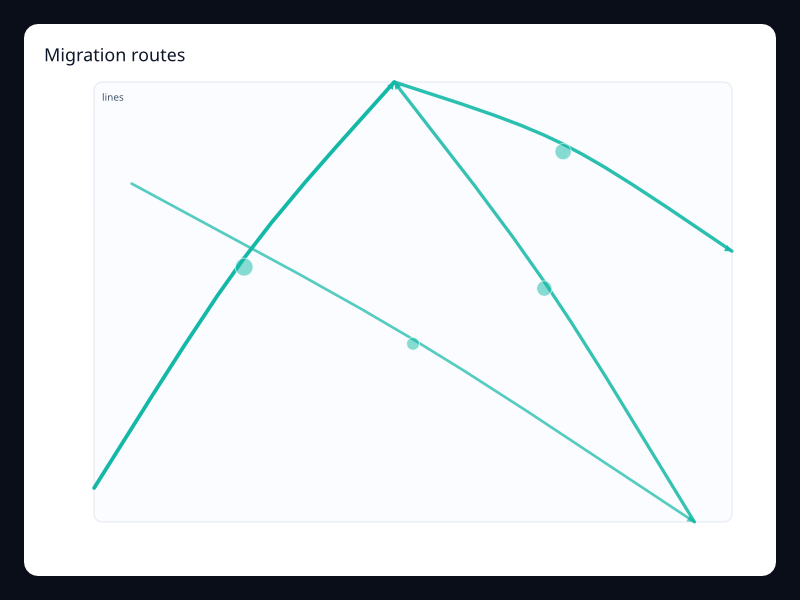
Route lines representing movement intensity. Use it for movement and transfer flows.
Data: Typed chart data, axes, and series.
Use when: Use it for movement and transfer flows
Tags: lines
Geo network
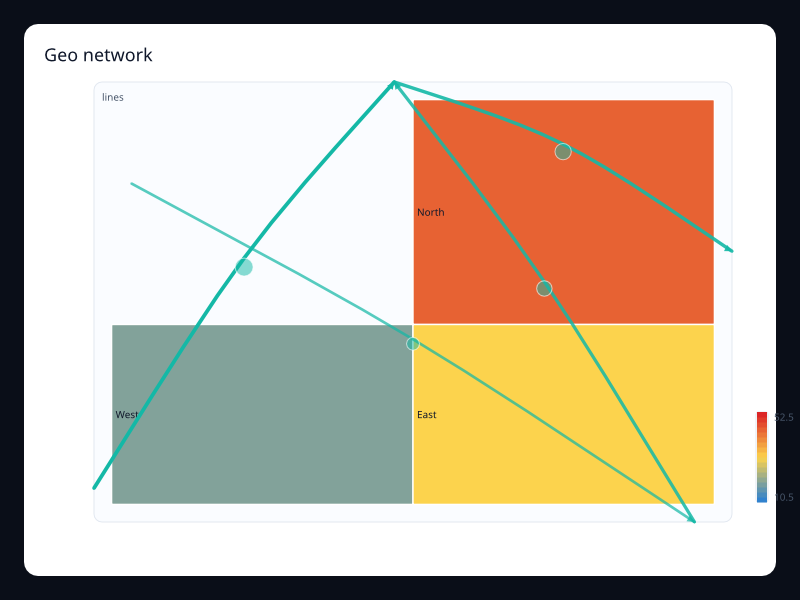
Map with network-like route overlays. Use it for network coverage and paths.
Data: Typed chart data, axes, and series.
Use when: Use it for network coverage and paths
Tags: map
Route arcs
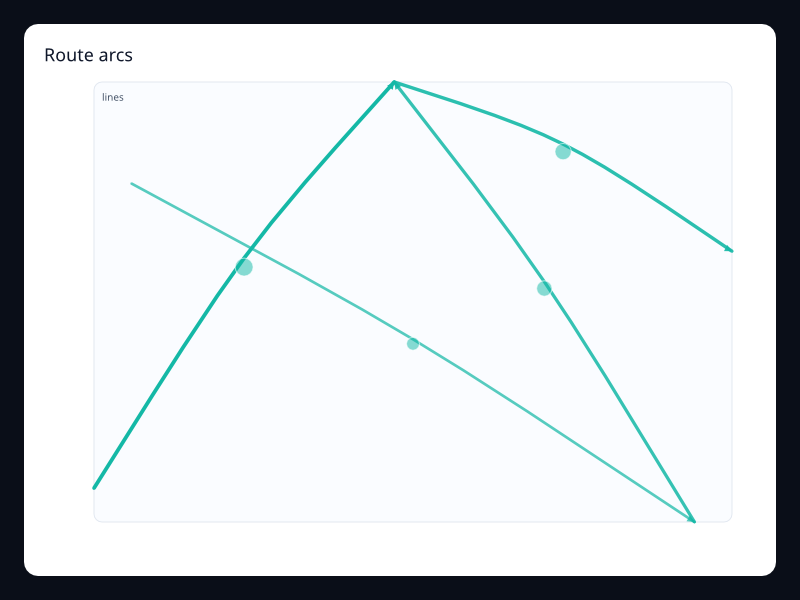
Curved route lines with direction. Use it for logistics and movement.
Data: Typed chart data, axes, and series.
Use when: Use it for logistics and movement
Tags: lines
Route map overlay
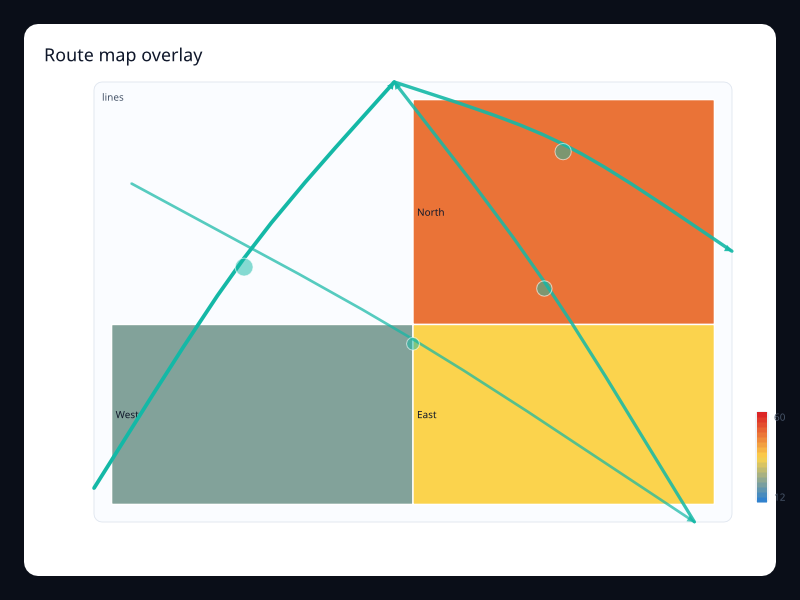
Routes drawn over geographic regions. Use it when geography and movement combine.
Data: Typed chart data, axes, and series.
Use when: Use it when geography and movement combine
Tags: map
Flight-like lines
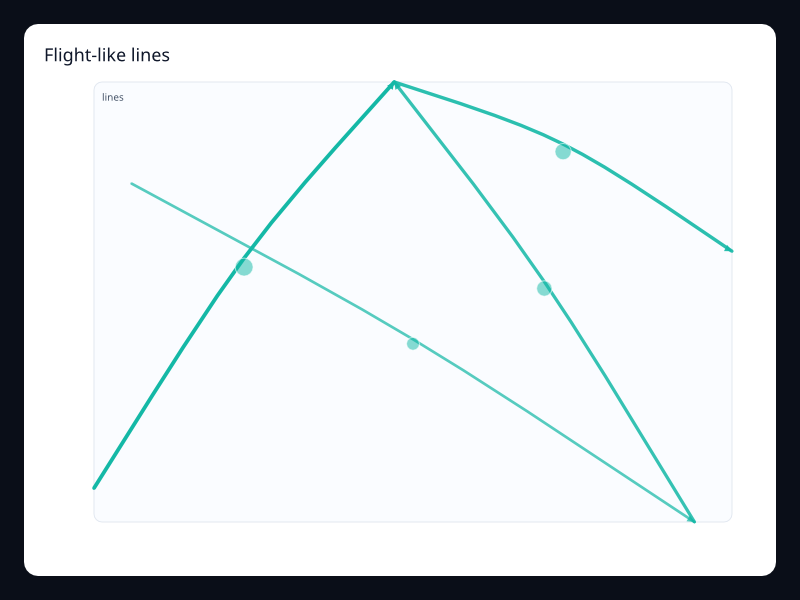
Directional curved lines with effect points. Use it for route animation-style visuals.
Data: Typed chart data, axes, and series.
Use when: Use it for route animation-style visuals
Tags: lines
Traffic lines
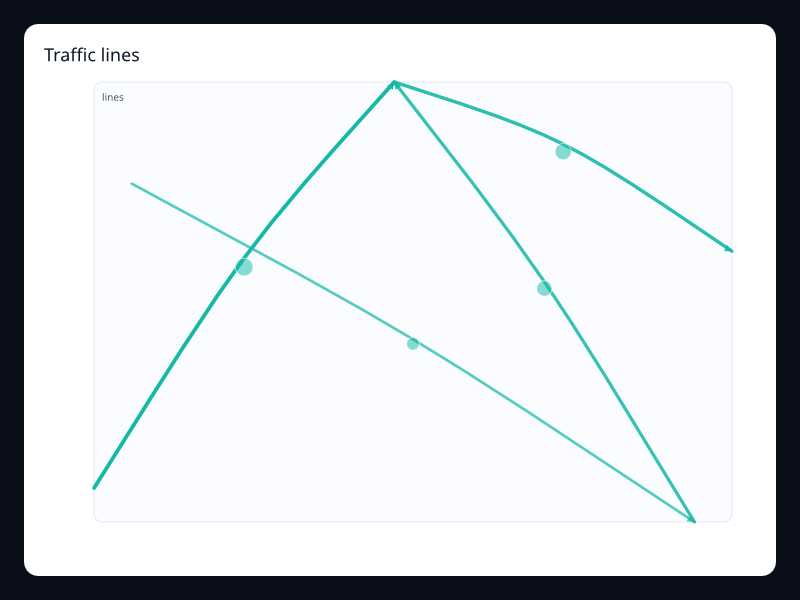
Curved lines with different values. Use it for traffic or flow intensity.
Data: Typed chart data, axes, and series.
Use when: Use it for traffic or flow intensity
Tags: lines
Region value map
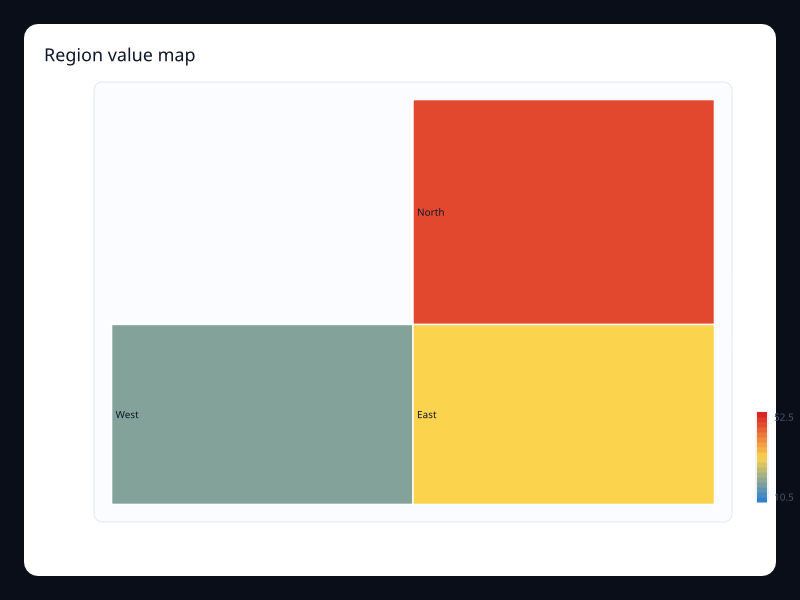
GeoJSON-backed choropleth map. Use it for geography-first comparisons.
Data: Typed chart data, axes, and series.
Use when: Use it for geography-first comparisons
Tags: map
Risk map
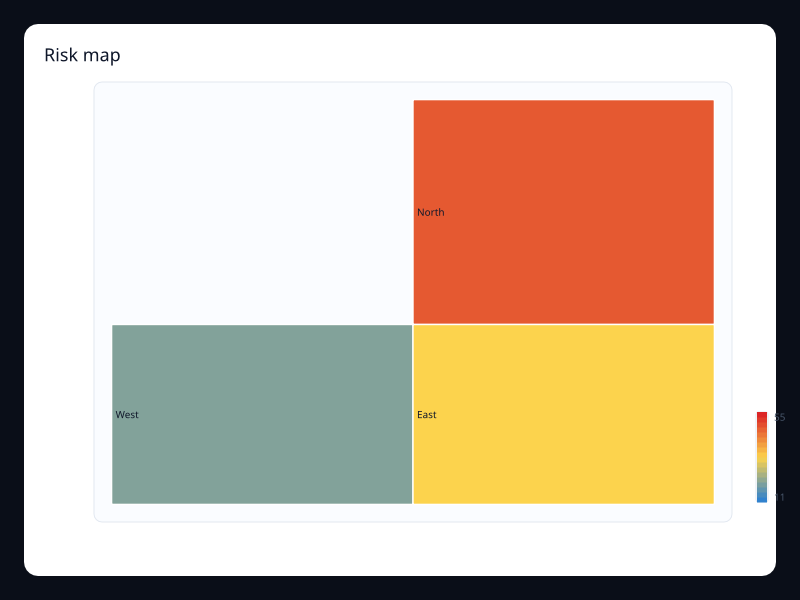
Regions colored by risk score. Use it for geographic risk dashboards.
Data: Typed chart data, axes, and series.
Use when: Use it for geographic risk dashboards
Tags: map
Sales map
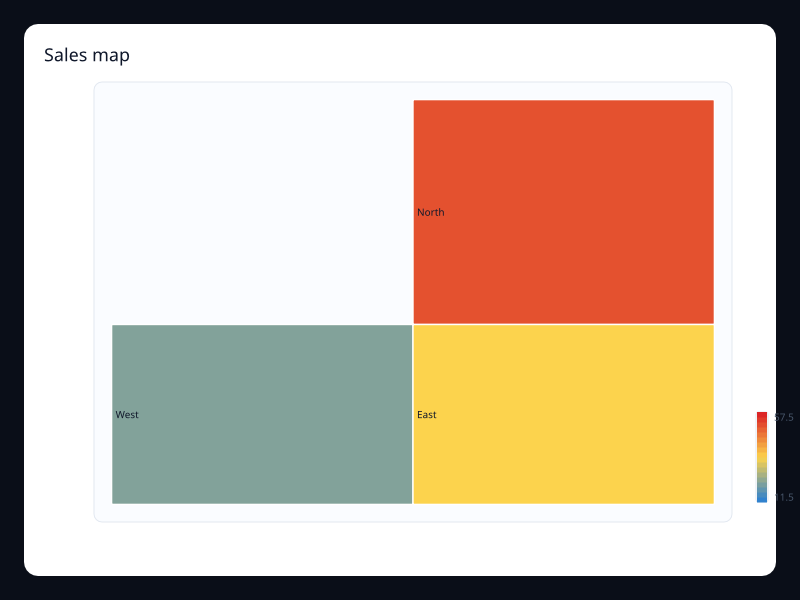
Region sales values on a map. Use it for regional business metrics.
Data: Typed chart data, axes, and series.
Use when: Use it for regional business metrics
Tags: map
Service coverage map
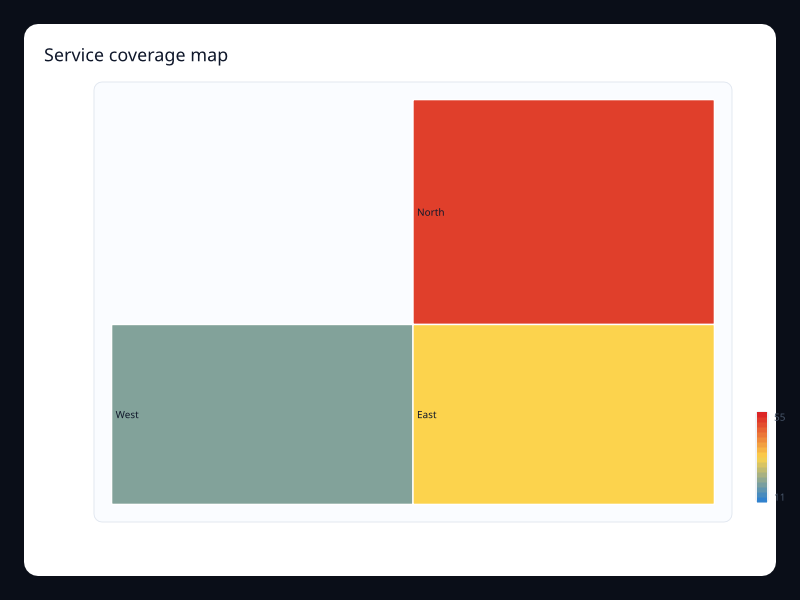
Map with coverage values by region. Use it for coverage and rollout screens.
Data: Typed chart data, axes, and series.
Use when: Use it for coverage and rollout screens
Tags: map
Geographic And Route
Geo lines
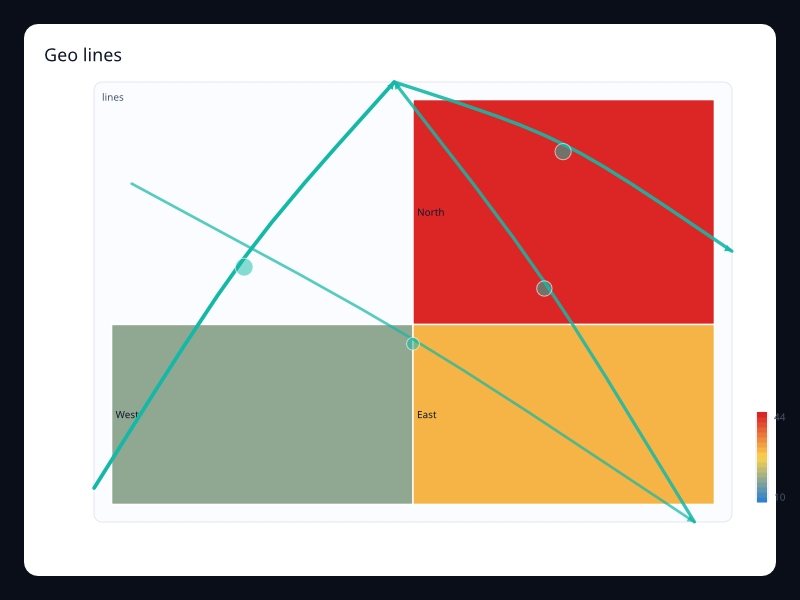
Route lines drawn over a GeoJSON-backed map. Use it when geography and movement need to be read together.
Data: Typed chart data, axes, and series.
Use when: Use it when geography and movement need to be read together
Tags: lines
Lines
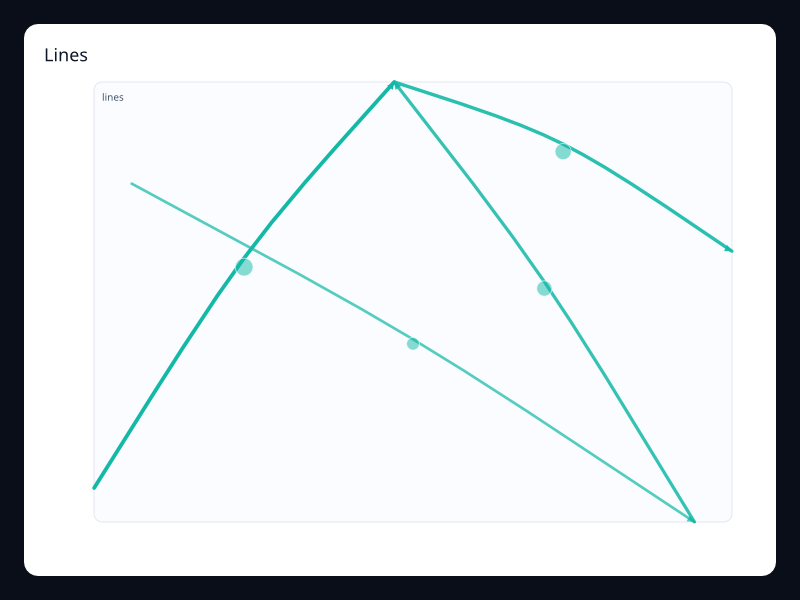
Curved line segments with direction and optional emphasis. Use it for routes, movement, and connection flow.
Data: Typed chart data, axes, and series.
Use when: Use it for routes, movement, and connection flow
Tags: lines
Choropleth map
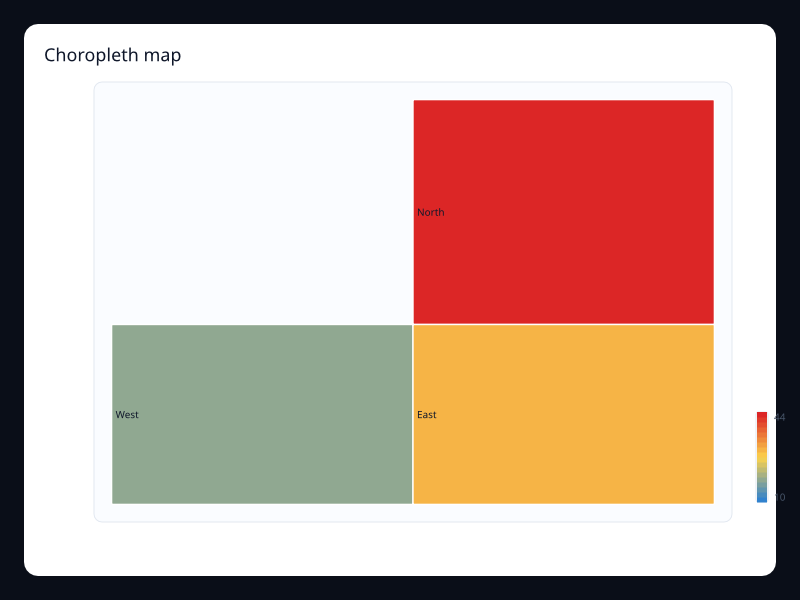
Regions colored by a numeric value. Use it for geography-first comparison.
Data: Typed chart data, axes, and series.
Use when: Use it for geography-first comparison
Tags: map
Route map
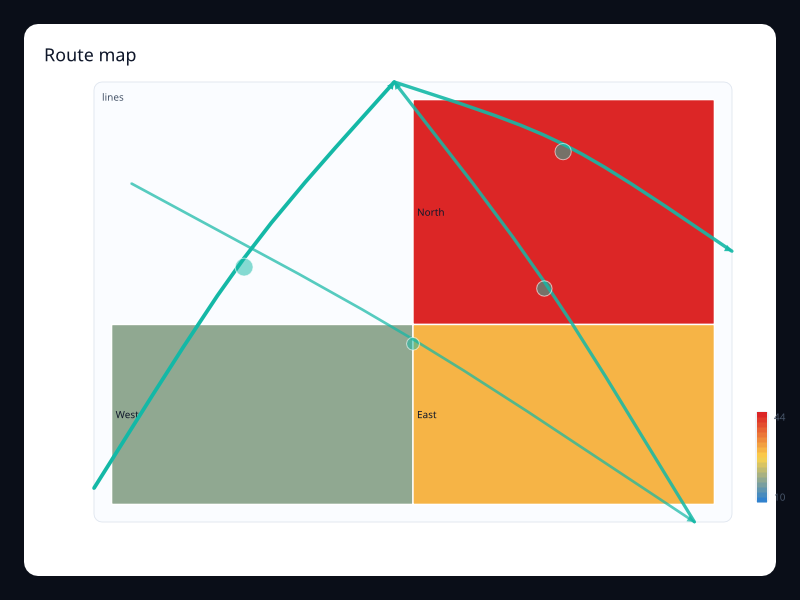
A map-focused route view with animated-looking line emphasis. Use it for logistics, traffic, or service coverage views.
Data: Typed chart data, axes, and series.
Use when: Use it for logistics, traffic, or service coverage views
Tags: map
Heatmap
Commit activity calendar
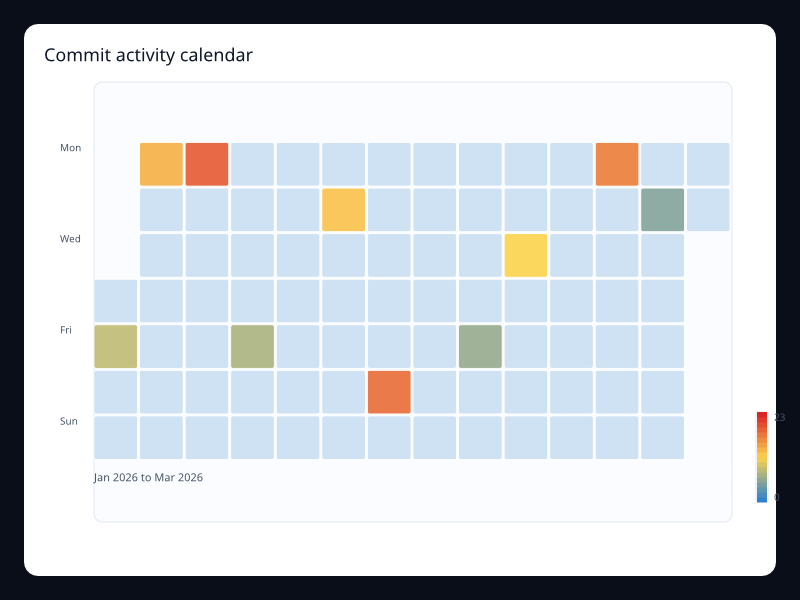
Commit activity calendar uses Fission Charts typed Rust data to render a production-ready heatmap view. Use it to show daily activity patterns.
Data: Typed chart data, axes, and series.
Use when: Use it to show daily activity patterns
Tags: calendar
Incident volume calendar
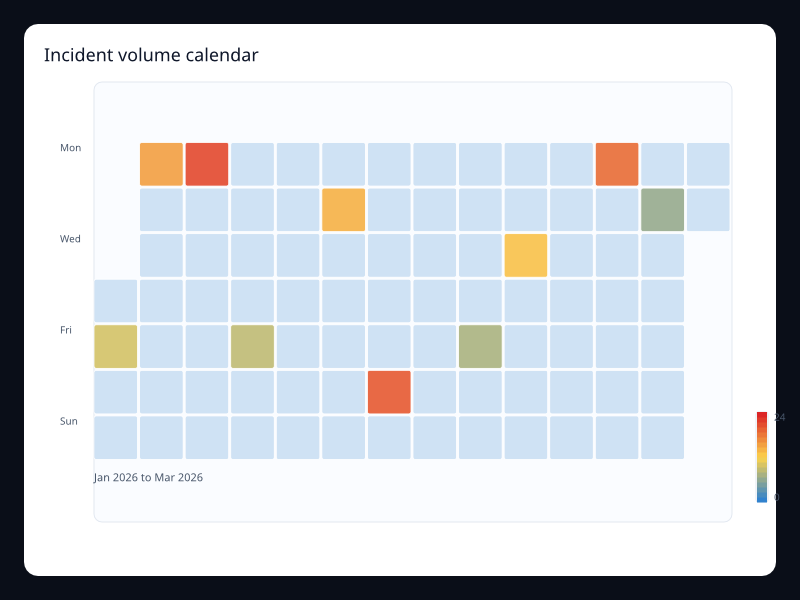
Incident volume calendar uses Fission Charts typed Rust data to render a production-ready heatmap view. Use it when the calendar shape carries meaning.
Data: Typed chart data, axes, and series.
Use when: Use it when the calendar shape carries meaning
Tags: calendar
Quality gates calendar
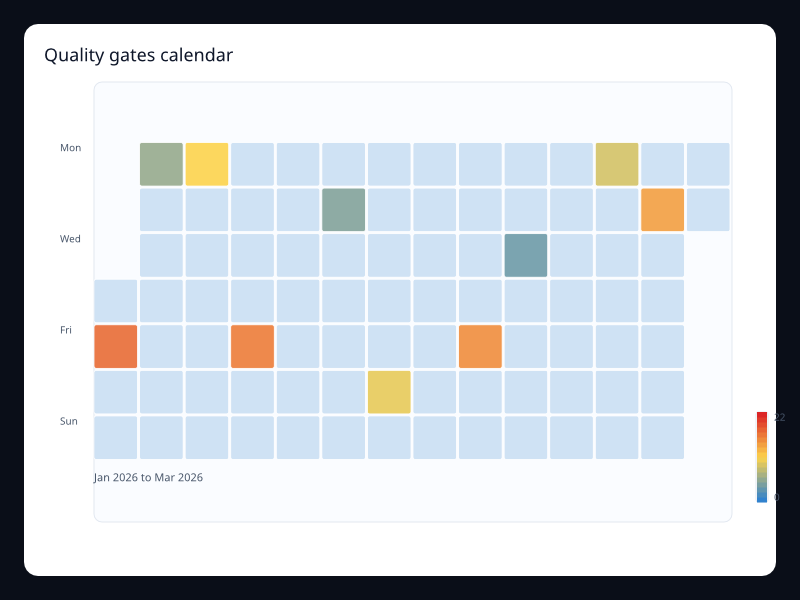
Quality gates calendar uses Fission Charts typed Rust data to render a production-ready heatmap view. Use it for quality gate consistency over time.
Data: Typed chart data, axes, and series.
Use when: Use it for quality gate consistency over time
Tags: calendar
Release burndown calendar
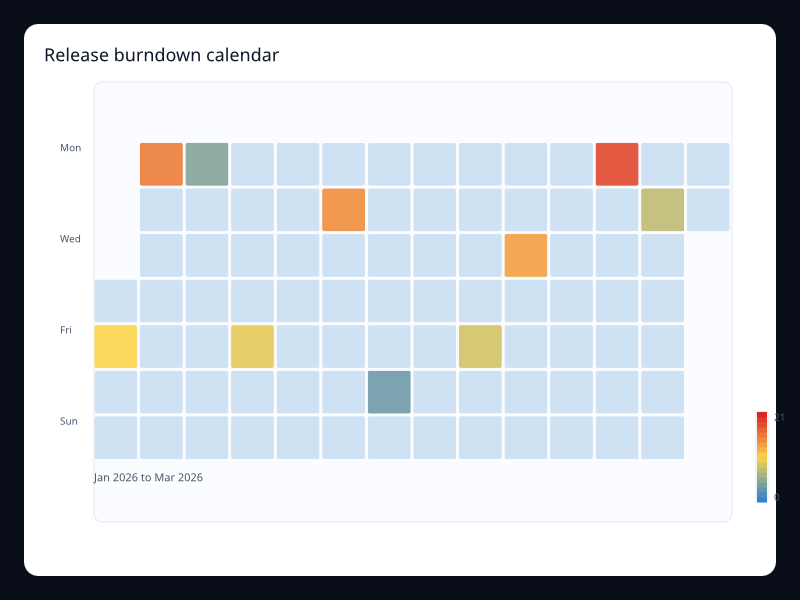
Release burndown calendar uses Fission Charts typed Rust data to render a production-ready heatmap view. Use it for calendar-driven delivery views.
Data: Typed chart data, axes, and series.
Use when: Use it for calendar-driven delivery views
Tags: calendar
Daily retention calendar
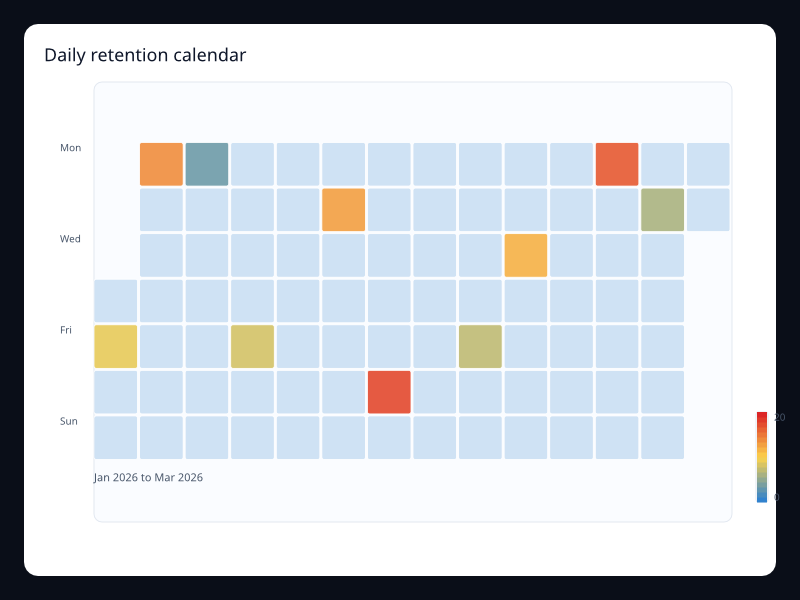
Daily retention calendar uses Fission Charts typed Rust data to render a production-ready heatmap view. Use it to scan day-level consistency.
Data: Typed chart data, axes, and series.
Use when: Use it to scan day-level consistency
Tags: calendar
Daily sales calendar
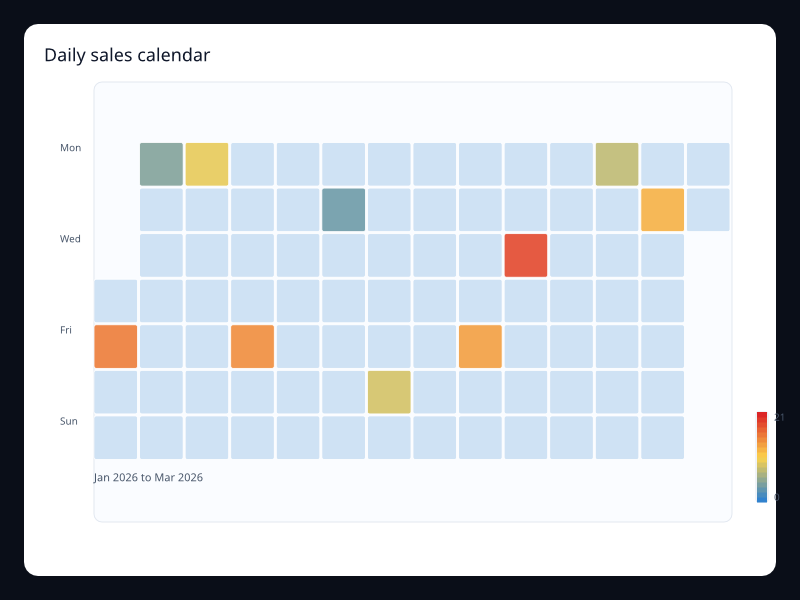
Daily sales calendar uses Fission Charts typed Rust data to render a production-ready heatmap view. Use it when weekday and date position matter.
Data: Typed chart data, axes, and series.
Use when: Use it when weekday and date position matter
Tags: calendar
User activity calendar
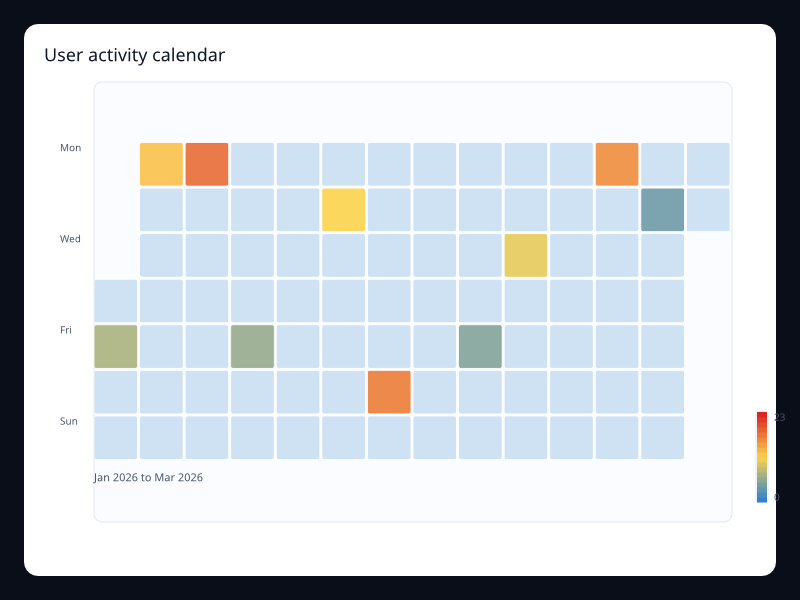
User activity calendar uses Fission Charts typed Rust data to render a production-ready heatmap view. Use it to show consistency and spikes over time.
Data: Typed chart data, axes, and series.
Use when: Use it to show consistency and spikes over time
Tags: calendar
Access matrix
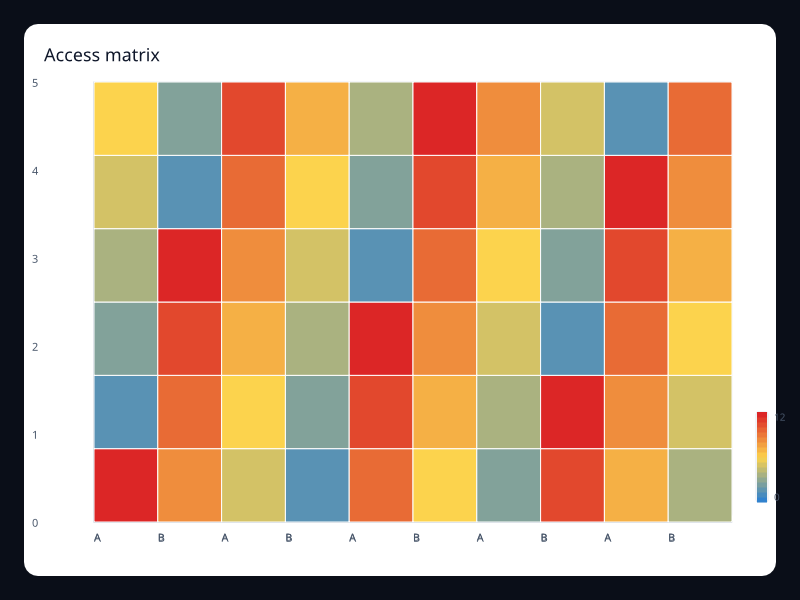
Access matrix uses Fission Charts typed Rust data to render a production-ready heatmap view. Use it for dense access and security matrices.
Data: Typed chart data, axes, and series.
Use when: Use it for dense access and security matrices
Tags: heatmap
Availability window
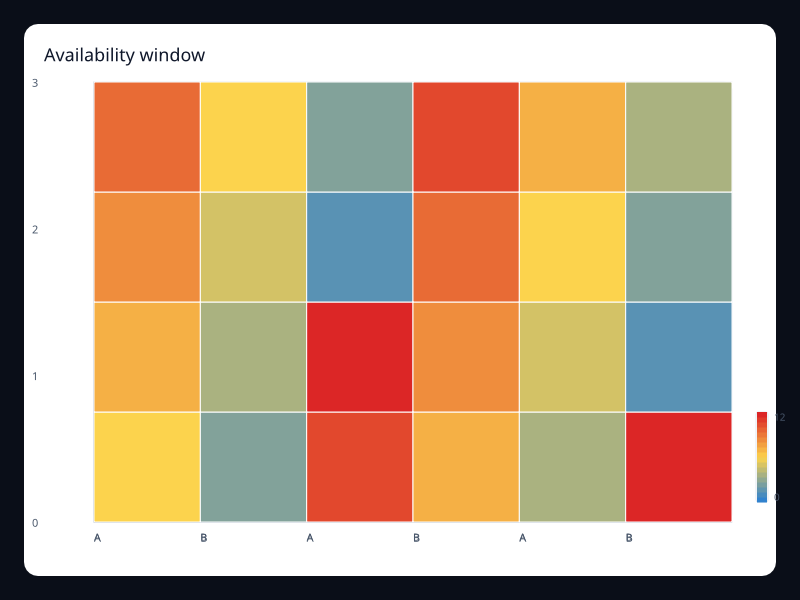
Availability window uses Fission Charts typed Rust data to render a production-ready heatmap view. Use it to compare uptime windows.
Data: Typed chart data, axes, and series.
Use when: Use it to compare uptime windows
Tags: heatmap
Correlation grid
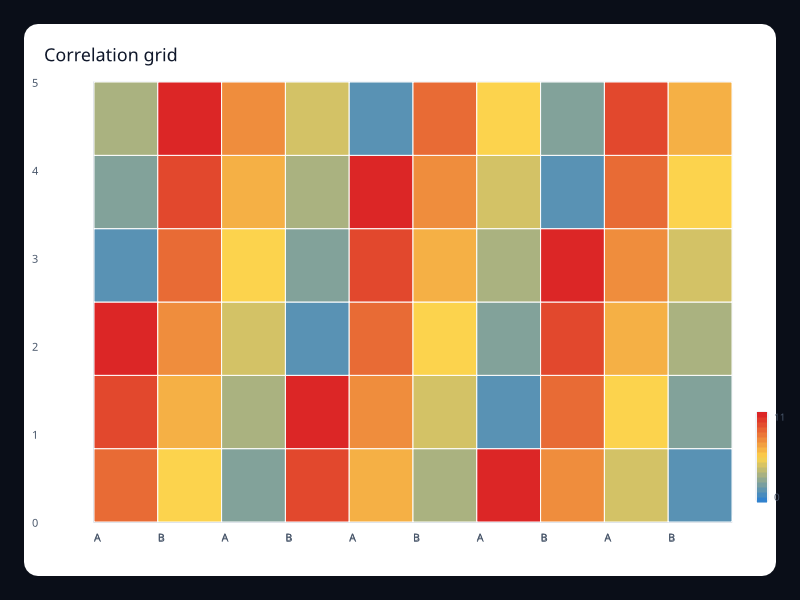
Correlation grid uses Fission Charts typed Rust data to render a production-ready heatmap view. Use it for correlation-like analysis.
Data: Typed chart data, axes, and series.
Use when: Use it for correlation-like analysis
Tags: heatmap
Deployment hour heatmap
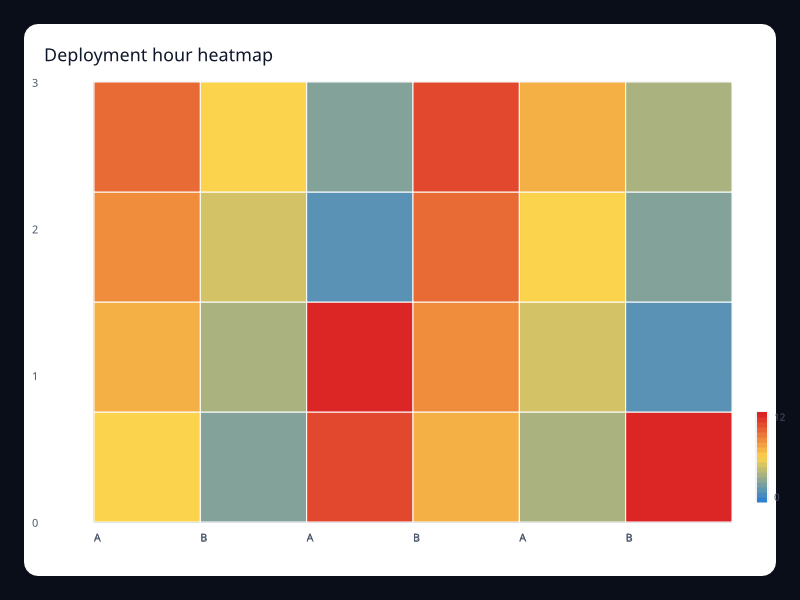
Deployment hour heatmap uses Fission Charts typed Rust data to render a production-ready heatmap view. Use it to find concentration by hour and day.
Data: Typed chart data, axes, and series.
Use when: Use it to find concentration by hour and day
Tags: heatmap
Feature usage heatmap
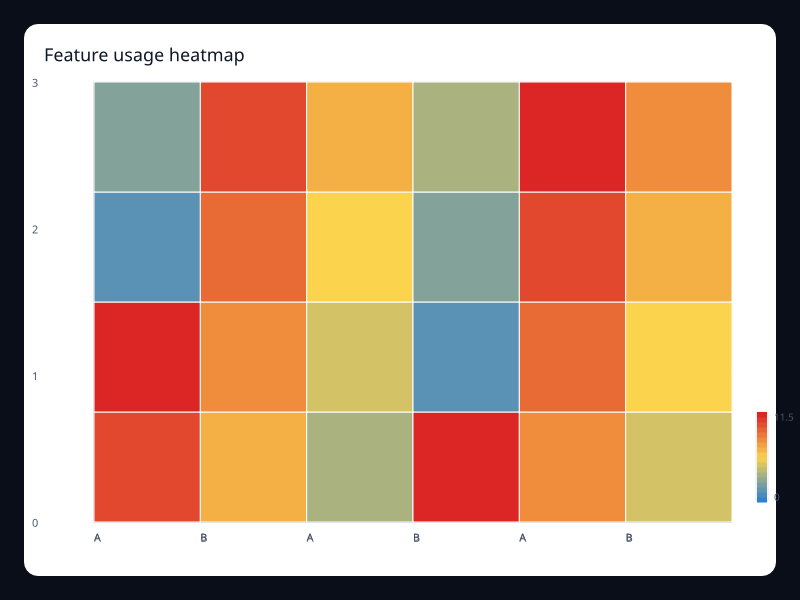
Feature usage heatmap uses Fission Charts typed Rust data to render a production-ready heatmap view. Use it to find usage hotspots.
Data: Typed chart data, axes, and series.
Use when: Use it to find usage hotspots
Tags: heatmap
Queue depth matrix
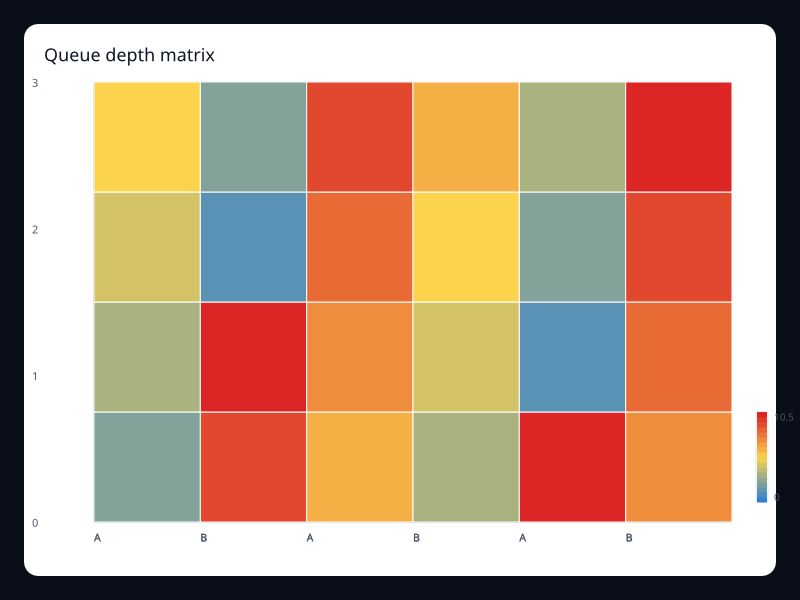
Queue depth matrix uses Fission Charts typed Rust data to render a production-ready heatmap view. Use it for operational queues.
Data: Typed chart data, axes, and series.
Use when: Use it for operational queues
Tags: heatmap
Regression risk matrix
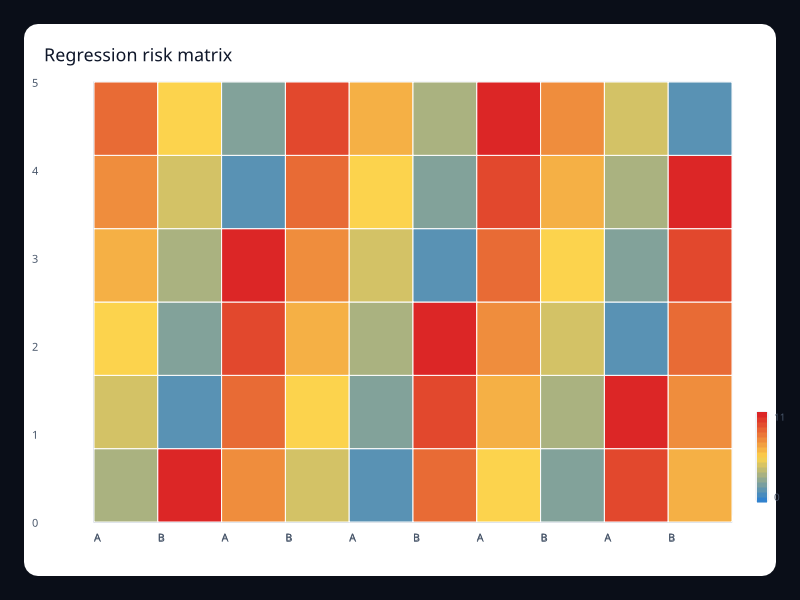
Regression risk matrix uses Fission Charts typed Rust data to render a production-ready heatmap view. Use it before releases to focus attention.
Data: Typed chart data, axes, and series.
Use when: Use it before releases to focus attention
Tags: heatmap
Resource saturation
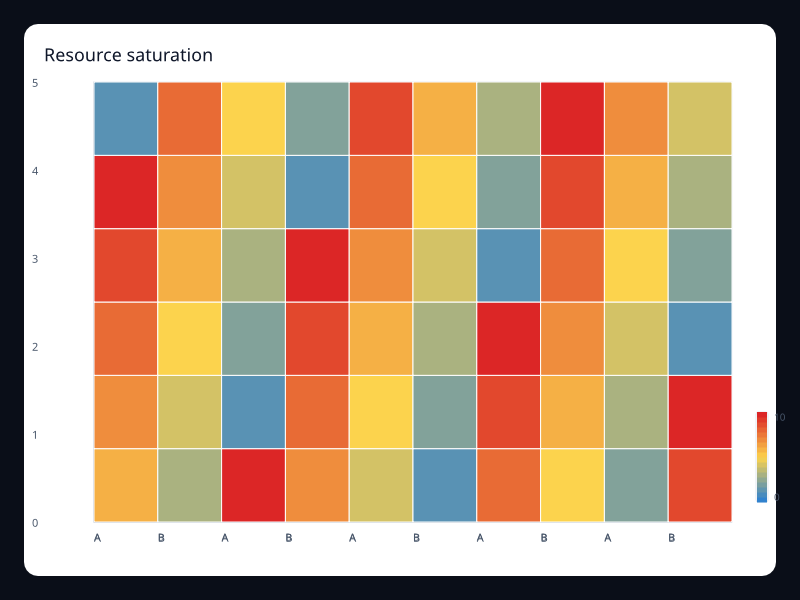
Resource saturation uses Fission Charts typed Rust data to render a production-ready heatmap view. Use it for infrastructure saturation.
Data: Typed chart data, axes, and series.
Use when: Use it for infrastructure saturation
Tags: heatmap
Service risk matrix
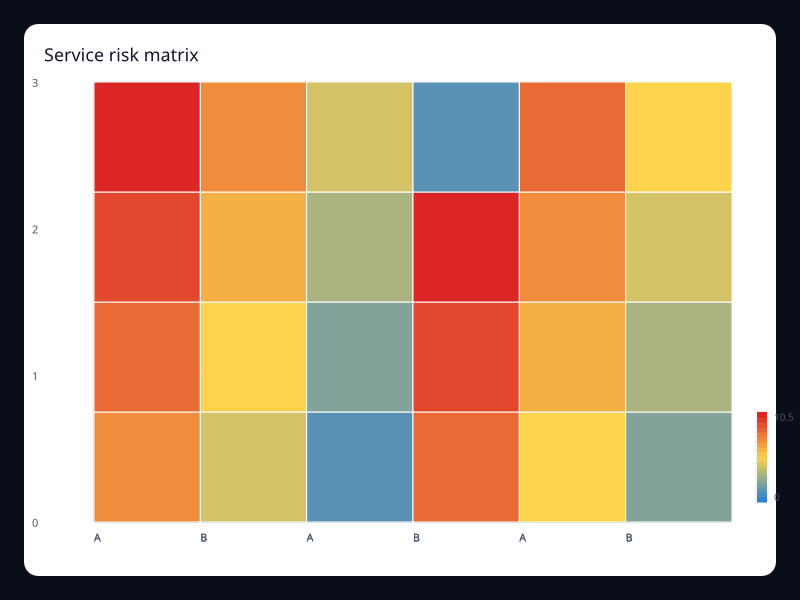
Service risk matrix uses Fission Charts typed Rust data to render a production-ready heatmap view. Use it when dense matrix comparison matters.
Data: Typed chart data, axes, and series.
Use when: Use it when dense matrix comparison matters
Tags: heatmap
Support load heatmap
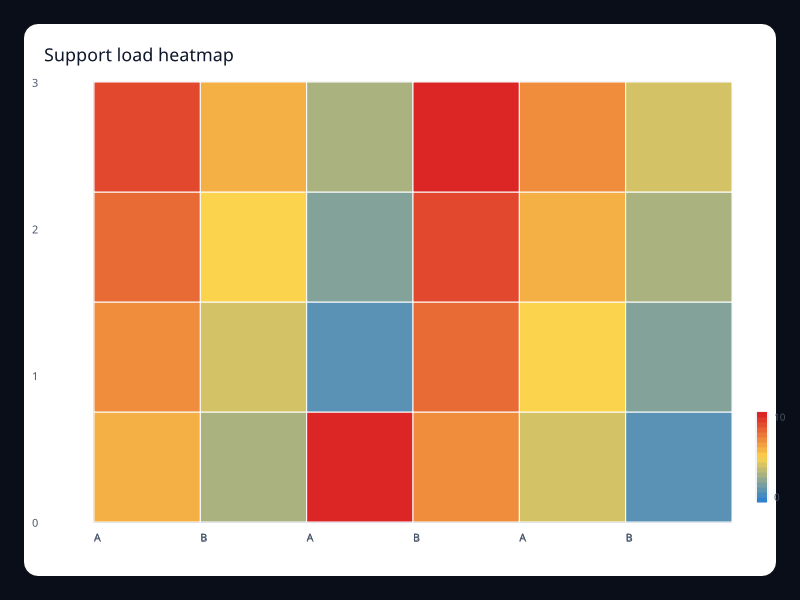
Support load heatmap uses Fission Charts typed Rust data to render a production-ready heatmap view. Use it for workload concentration.
Data: Typed chart data, axes, and series.
Use when: Use it for workload concentration
Tags: heatmap
Visual map build calendar
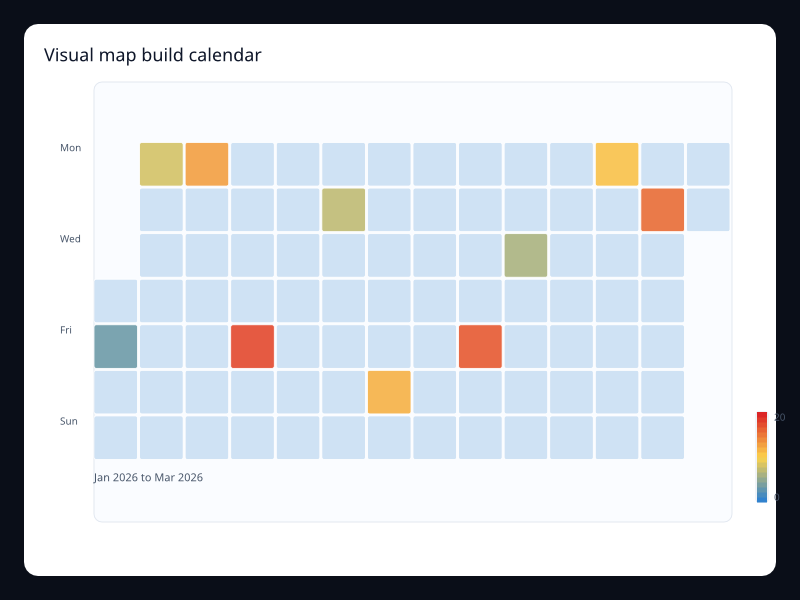
Visual map build calendar uses Fission Charts typed Rust data to render a production-ready heatmap view. Use it when calendar and intensity both matter.
Data: Typed chart data, axes, and series.
Use when: Use it when calendar and intensity both matter
Tags: visualMap
Density visual map
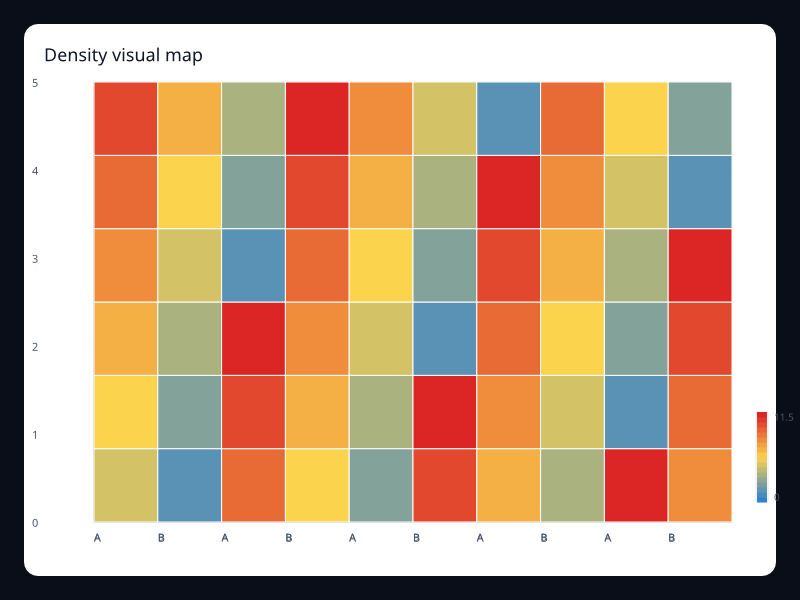
Density visual map uses Fission Charts typed Rust data to render a production-ready heatmap view. Use it for density and occupancy surfaces.
Data: Typed chart data, axes, and series.
Use when: Use it for density and occupancy surfaces
Tags: visualMap
Load grid visual map
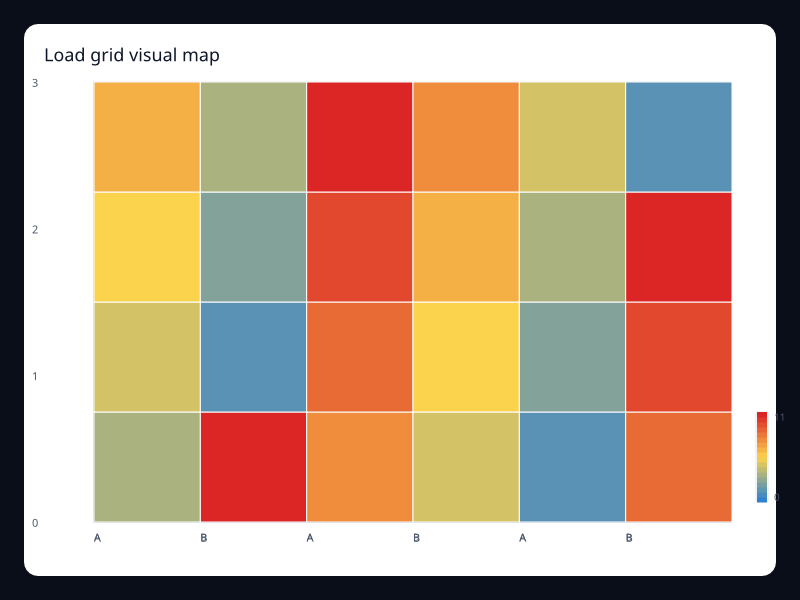
Load grid visual map uses Fission Charts typed Rust data to render a production-ready heatmap view. Use it when color should explain intensity.
Data: Typed chart data, axes, and series.
Use when: Use it when color should explain intensity
Tags: visualMap
Heatmap And Calendar
Build calendar
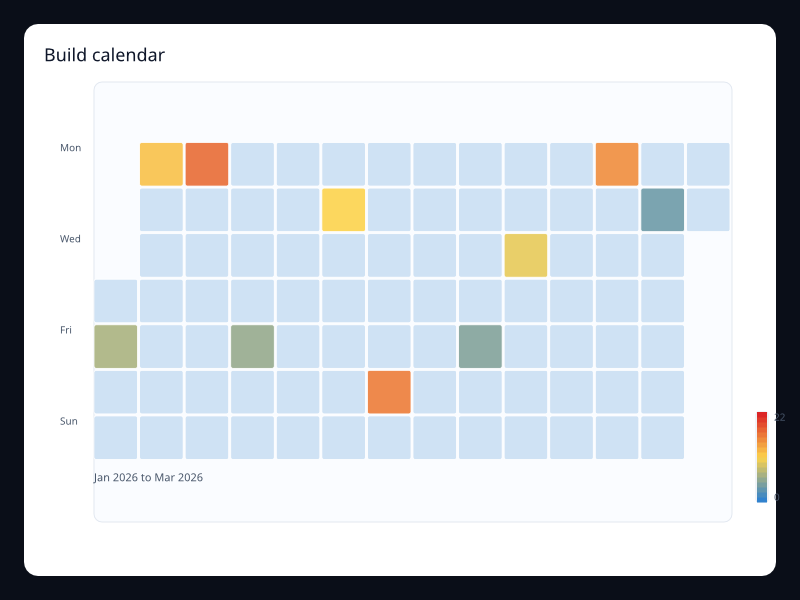
Calendar heatmap for build volume. Use it for engineering operations.
Data: Typed chart data, axes, and series.
Use when: Use it for engineering operations
Tags: calendar
Incident calendar
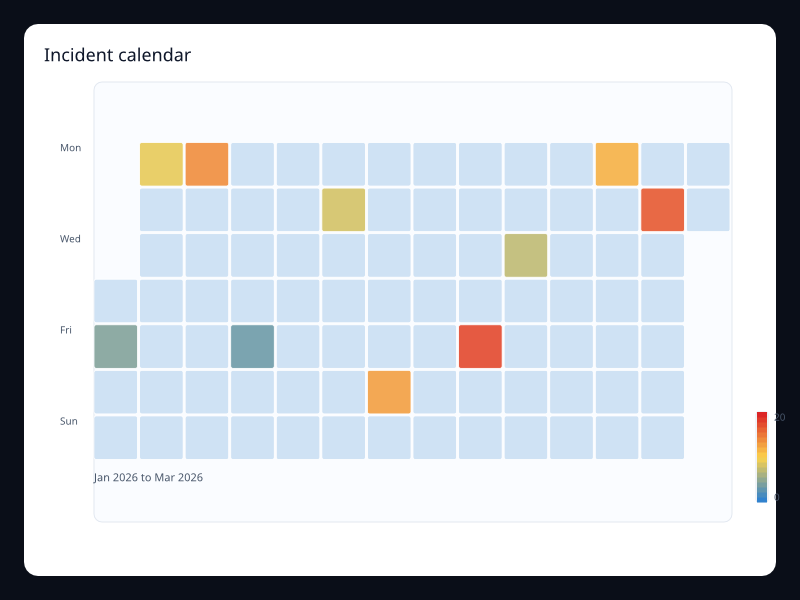
Calendar heatmap for incident counts. Use it for reliability and support reporting.
Data: Typed chart data, axes, and series.
Use when: Use it for reliability and support reporting
Tags: calendar
Quarter calendar heatmap
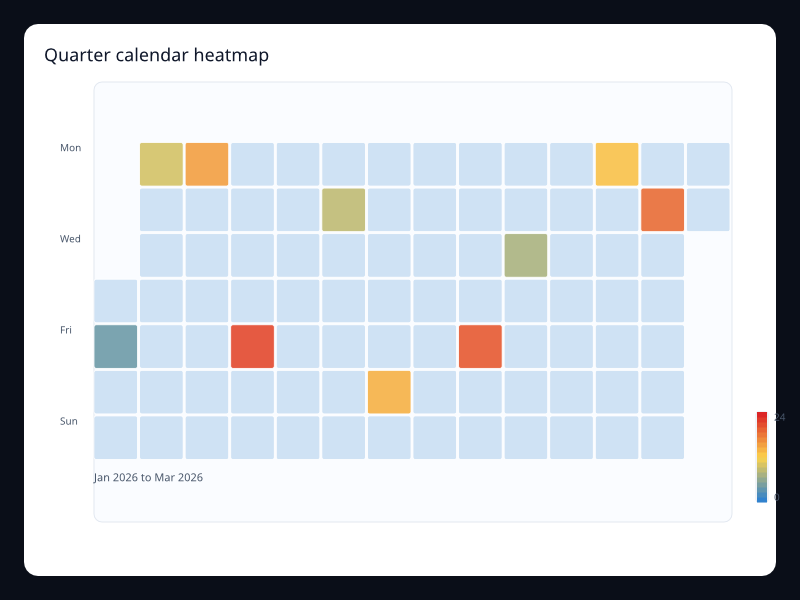
Calendar heatmap for a quarter of activity. Use it for contribution and activity patterns.
Data: Typed chart data, axes, and series.
Use when: Use it for contribution and activity patterns
Tags: calendar
Retention calendar
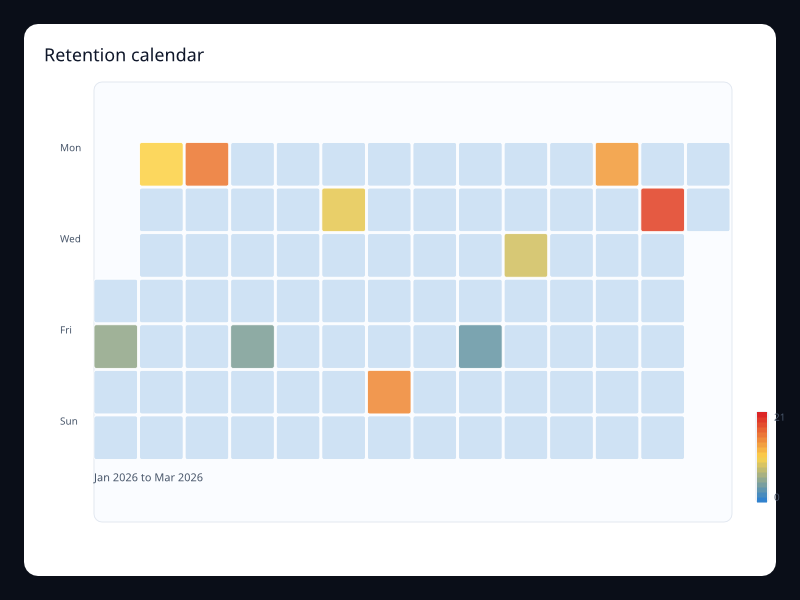
Calendar heatmap for retained activity. Use it for habit and retention surfaces.
Data: Typed chart data, axes, and series.
Use when: Use it for habit and retention surfaces
Tags: calendar
Availability heatmap
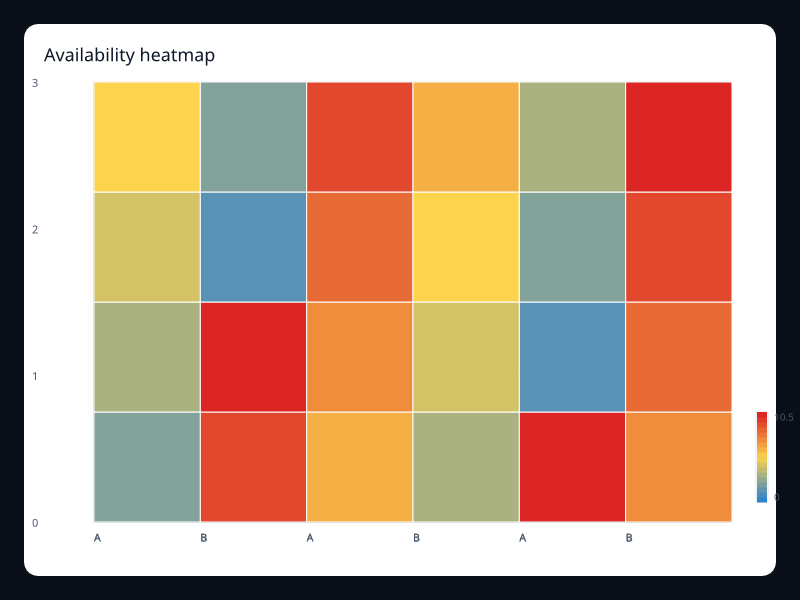
Availability values across services and periods. Use it for SRE and operations dashboards.
Data: Typed chart data, axes, and series.
Use when: Use it for SRE and operations dashboards
Tags: heatmap
Correlation heatmap
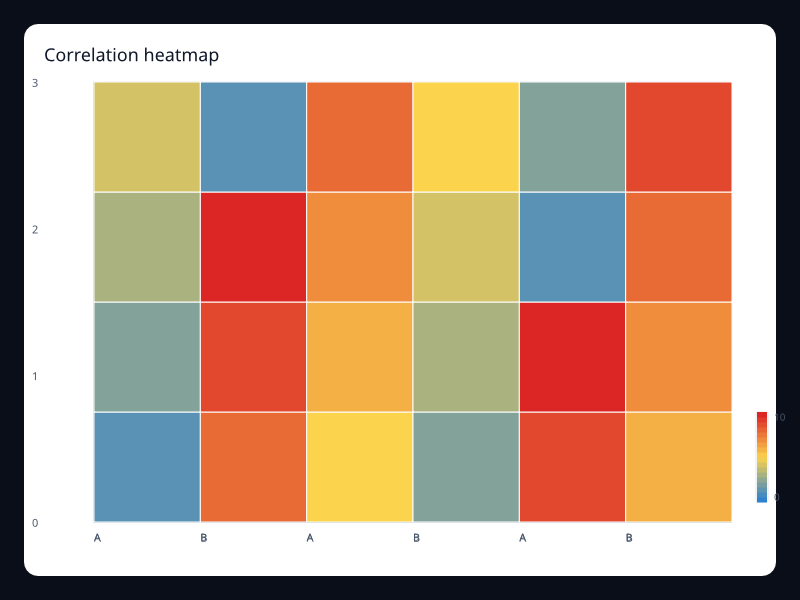
Square-style heatmap for correlation-like data. Use it for relationship strength matrices.
Data: Typed chart data, axes, and series.
Use when: Use it for relationship strength matrices
Tags: heatmap
Large matrix heatmap
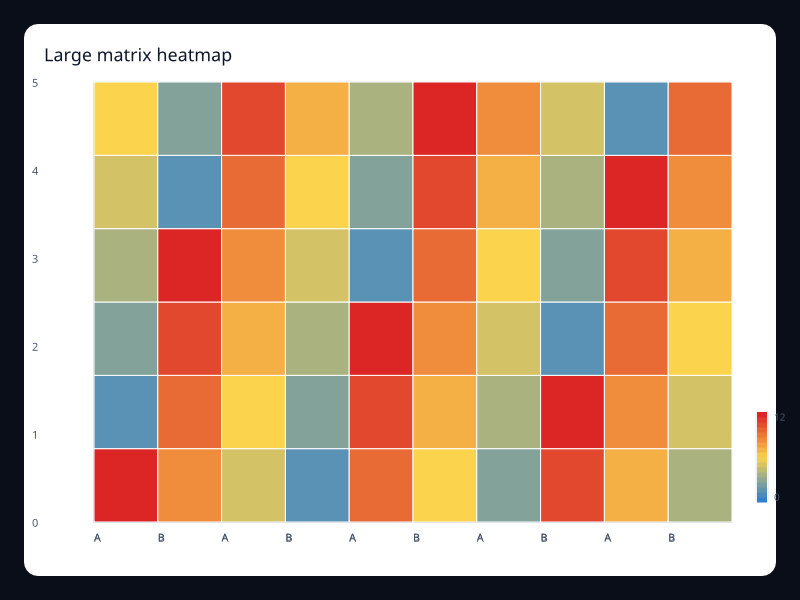
Larger heatmap with more cells. Use it for activity grids with many columns.
Data: Typed chart data, axes, and series.
Use when: Use it for activity grids with many columns
Tags: heatmap
Resource load heatmap
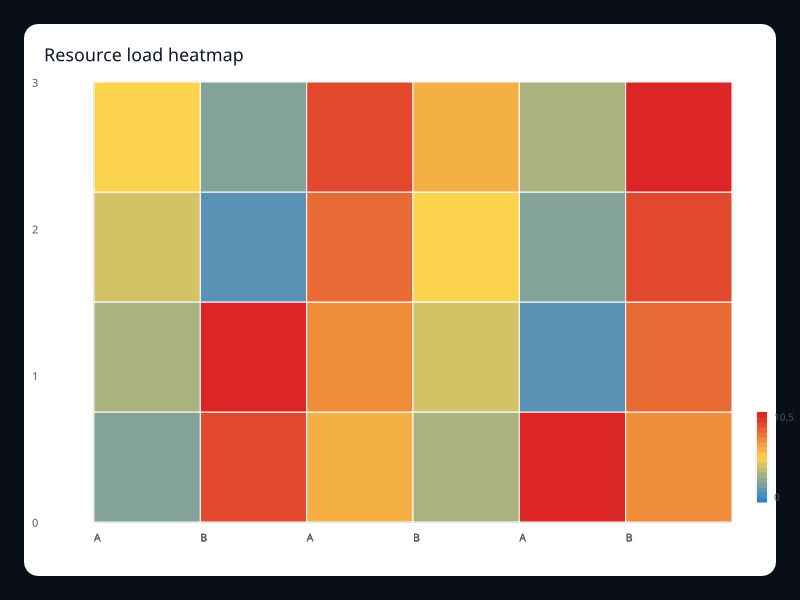
Heatmap showing resource load across services. Use it for capacity and utilization panels.
Data: Typed chart data, axes, and series.
Use when: Use it for capacity and utilization panels
Tags: heatmap
Risk grid heatmap
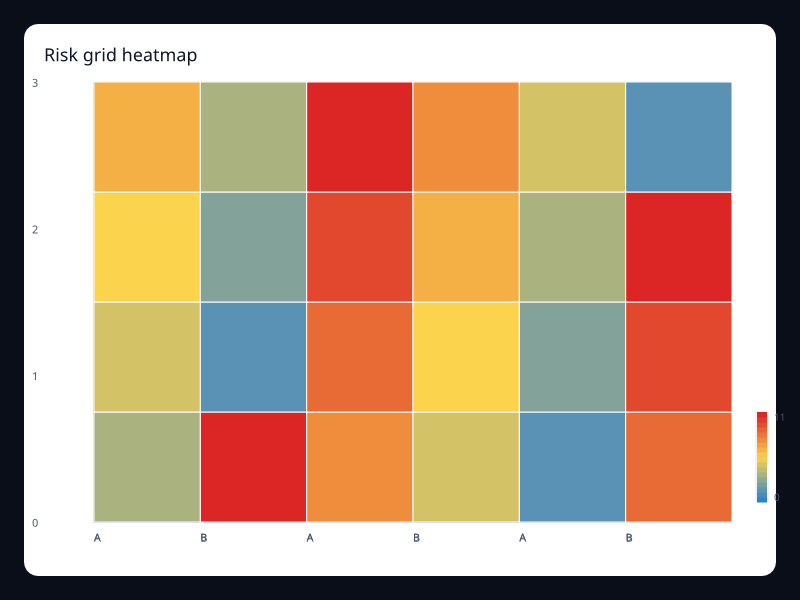
Risk values in a two-axis matrix. Use it for risk and priority matrices.
Data: Typed chart data, axes, and series.
Use when: Use it for risk and priority matrices
Tags: heatmap
Small matrix heatmap
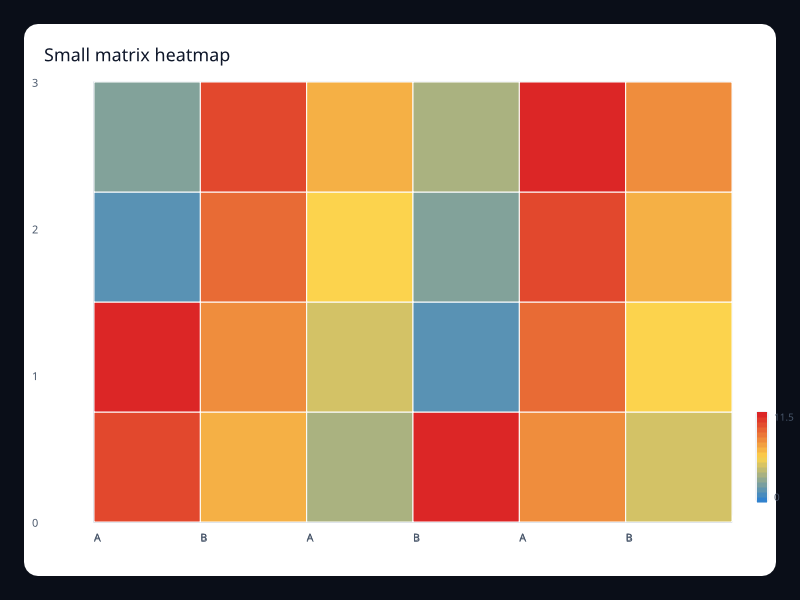
Compact heatmap for a small matrix. Use it for dashboards with limited space.
Data: Typed chart data, axes, and series.
Use when: Use it for dashboards with limited space
Tags: heatmap
Weekday hour heatmap
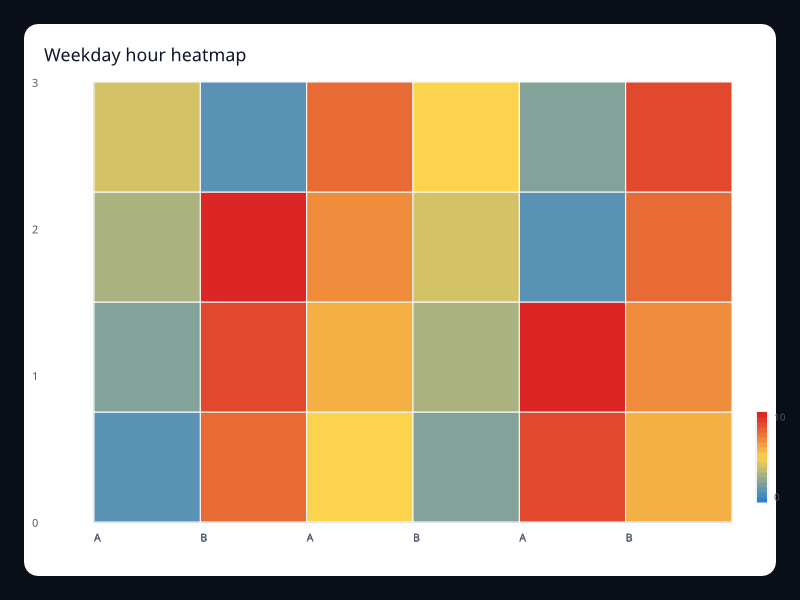
Matrix heatmap for activity by hour and weekday. Use it for operational intensity matrices.
Data: Typed chart data, axes, and series.
Use when: Use it for operational intensity matrices
Tags: heatmap
Visual map density
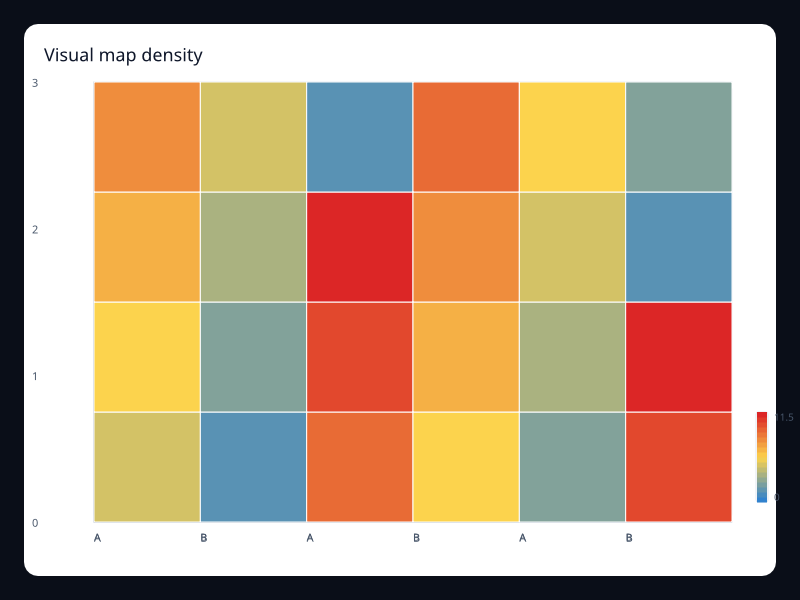
Heatmap with explicit visual map color scale. Use it when color needs a visible numeric range.
Data: Typed chart data, axes, and series.
Use when: Use it when color needs a visible numeric range
Tags: visual-map
Hierarchy
Alert correlation graph
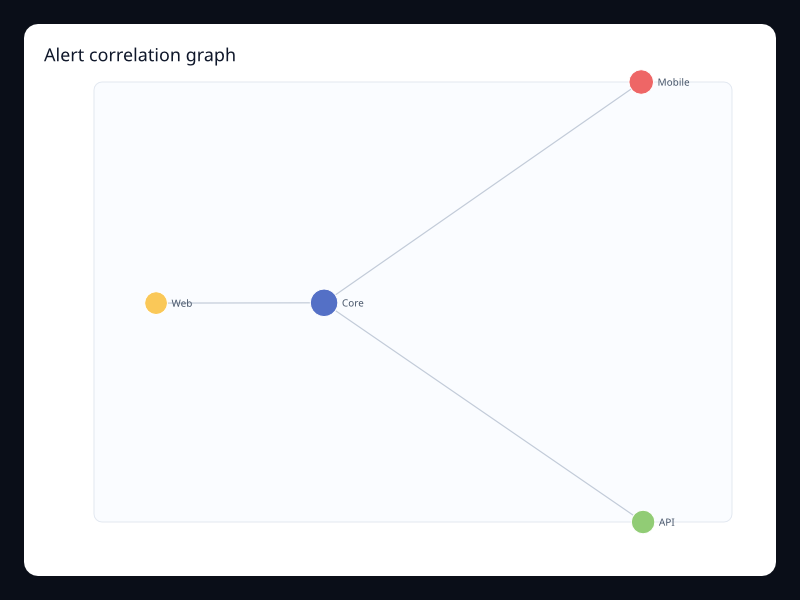
Alert correlation graph uses Fission Charts typed Rust data to render a production-ready hierarchy view. Use it for incident analysis.
Data: Typed chart data, axes, and series.
Use when: Use it for incident analysis
Tags: graph
Customer journey graph
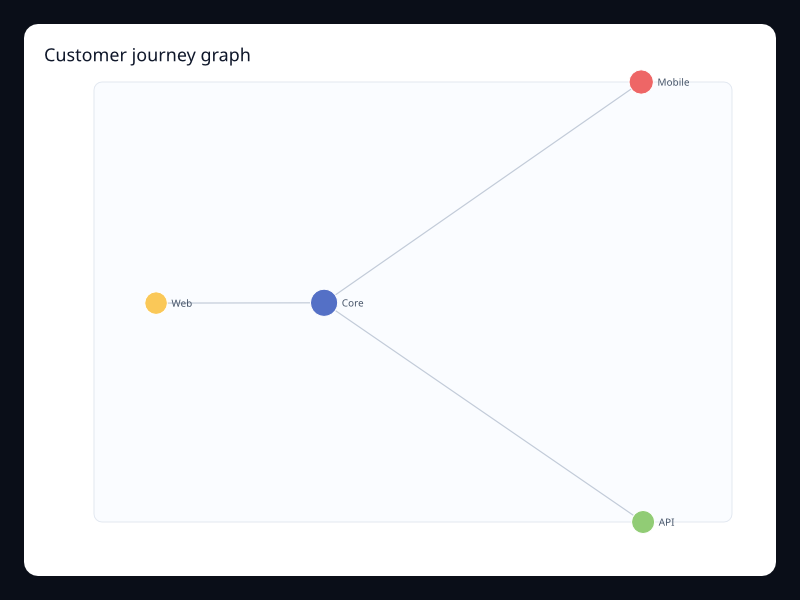
Customer journey graph uses Fission Charts typed Rust data to render a production-ready hierarchy view. Use it when paths and relationships matter more than axes.
Data: Typed chart data, axes, and series.
Use when: Use it when paths and relationships matter more than axes
Tags: graph
Platform topology graph
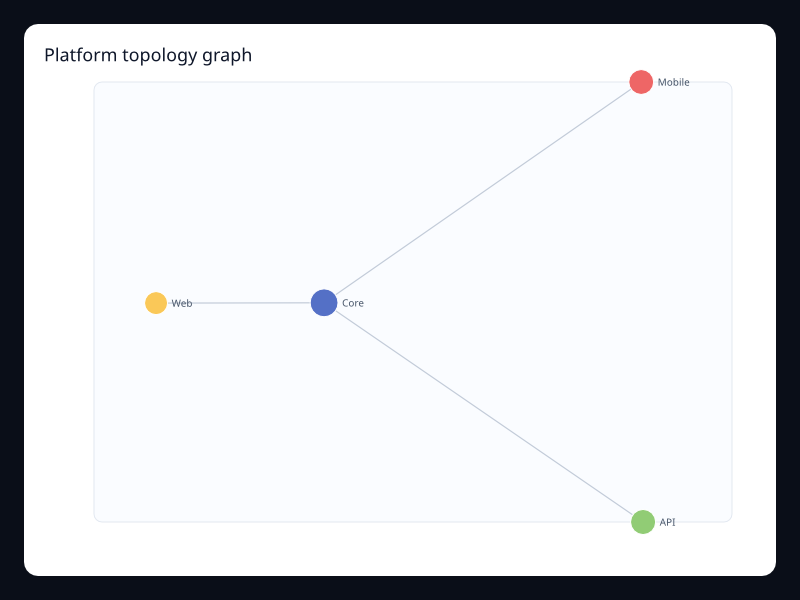
Platform topology graph uses Fission Charts typed Rust data to render a production-ready hierarchy view. Use it for system overview screens.
Data: Typed chart data, axes, and series.
Use when: Use it for system overview screens
Tags: graph
Service dependencies
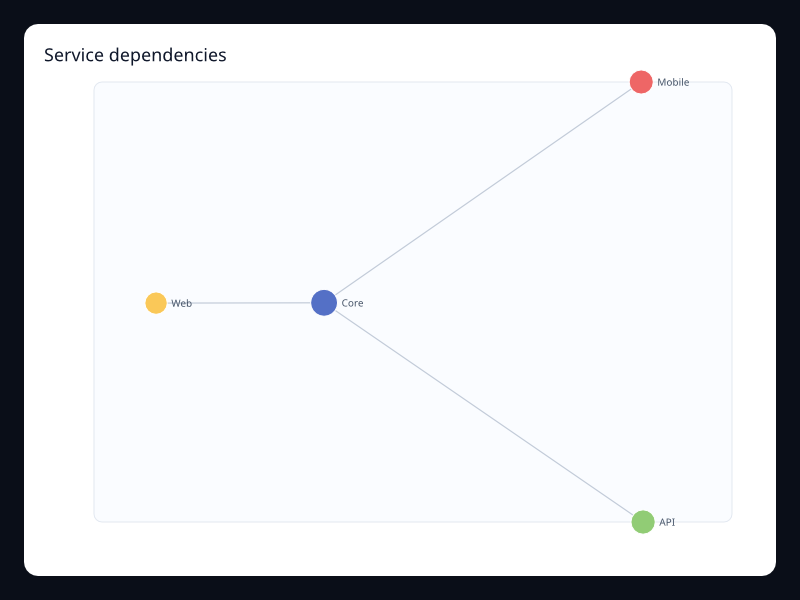
Service dependencies uses Fission Charts typed Rust data to render a production-ready hierarchy view. Use it to explain relationship topology.
Data: Typed chart data, axes, and series.
Use when: Use it to explain relationship topology
Tags: graph
Energy balance sankey
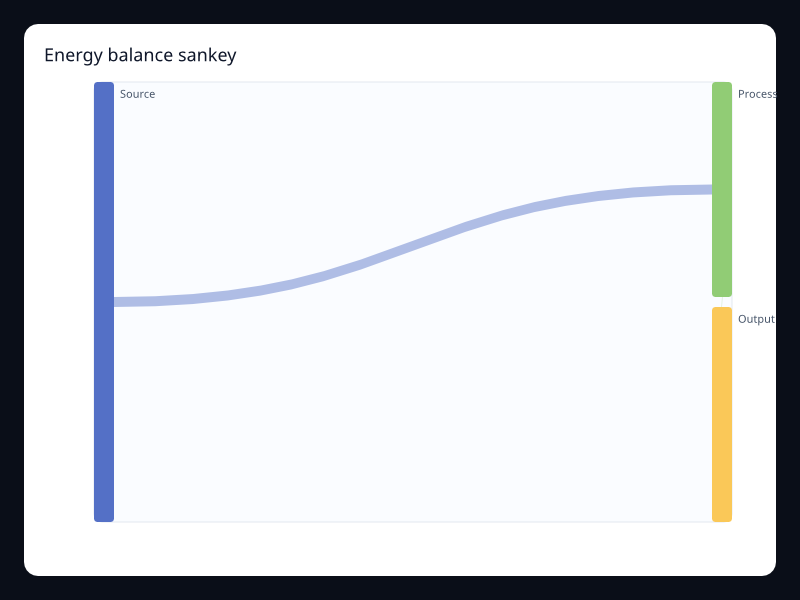
Energy balance sankey uses Fission Charts typed Rust data to render a production-ready hierarchy view. Use it for transfer and loss diagrams.
Data: Typed chart data, axes, and series.
Use when: Use it for transfer and loss diagrams
Tags: sankey
Lead flow sankey
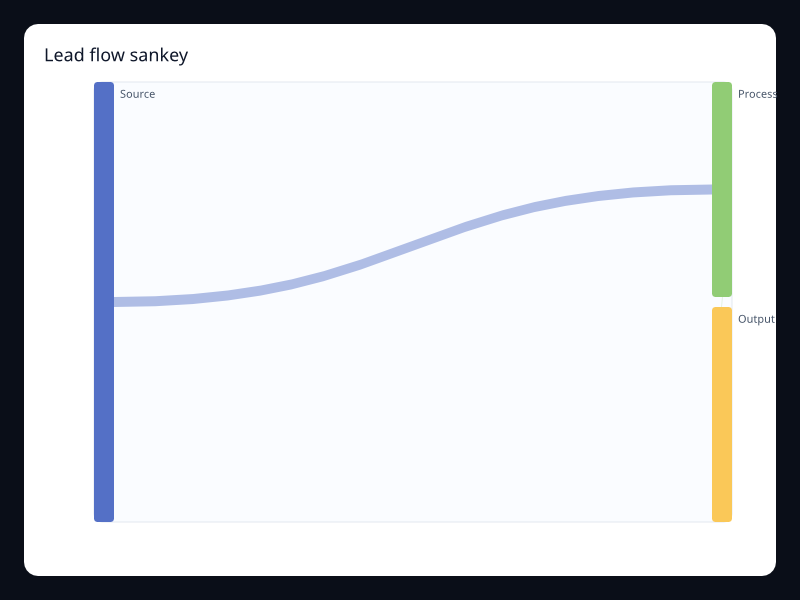
Lead flow sankey uses Fission Charts typed Rust data to render a production-ready hierarchy view. Use it when movement between stages is the question.
Data: Typed chart data, axes, and series.
Use when: Use it when movement between stages is the question
Tags: sankey
Resolution path sankey
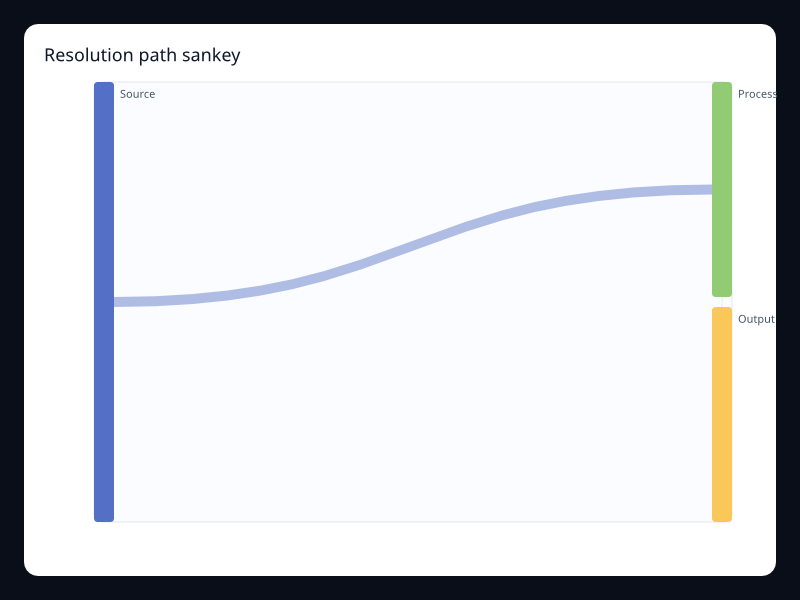
Resolution path sankey uses Fission Charts typed Rust data to render a production-ready hierarchy view. Use it to analyze process movement.
Data: Typed chart data, axes, and series.
Use when: Use it to analyze process movement
Tags: sankey
Customer segment sunburst
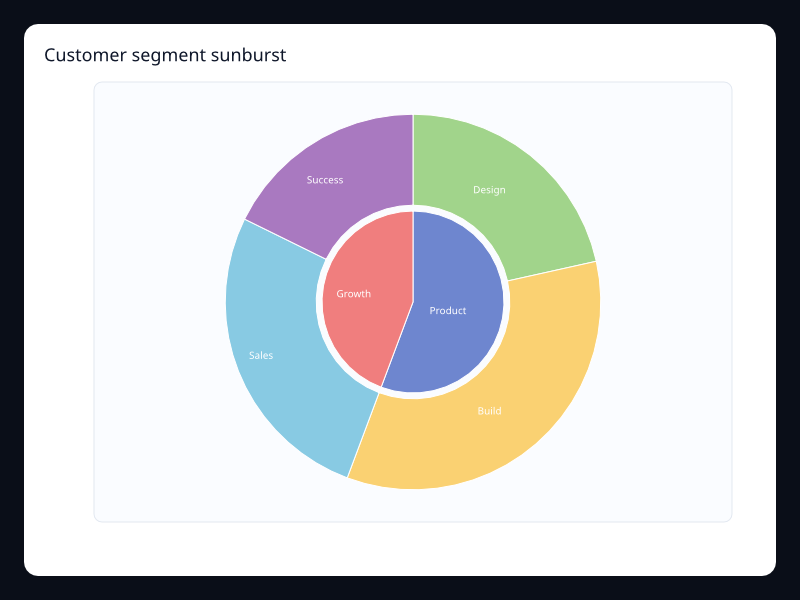
Customer segment sunburst uses Fission Charts typed Rust data to render a production-ready hierarchy view. Use it for segment hierarchy and share.
Data: Typed chart data, axes, and series.
Use when: Use it for segment hierarchy and share
Tags: sunburst
Feature area sunburst
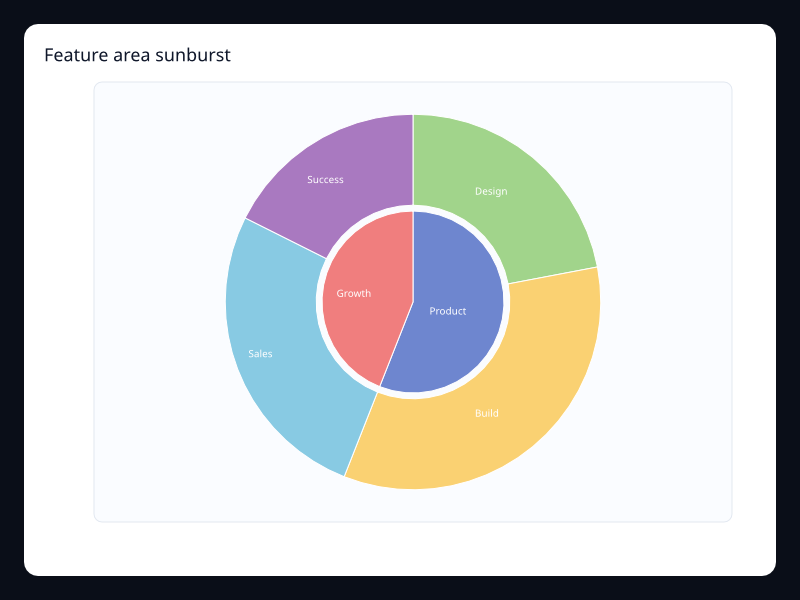
Feature area sunburst uses Fission Charts typed Rust data to render a production-ready hierarchy view. Use it for hierarchical composition with depth.
Data: Typed chart data, axes, and series.
Use when: Use it for hierarchical composition with depth
Tags: sunburst
Org revenue sunburst
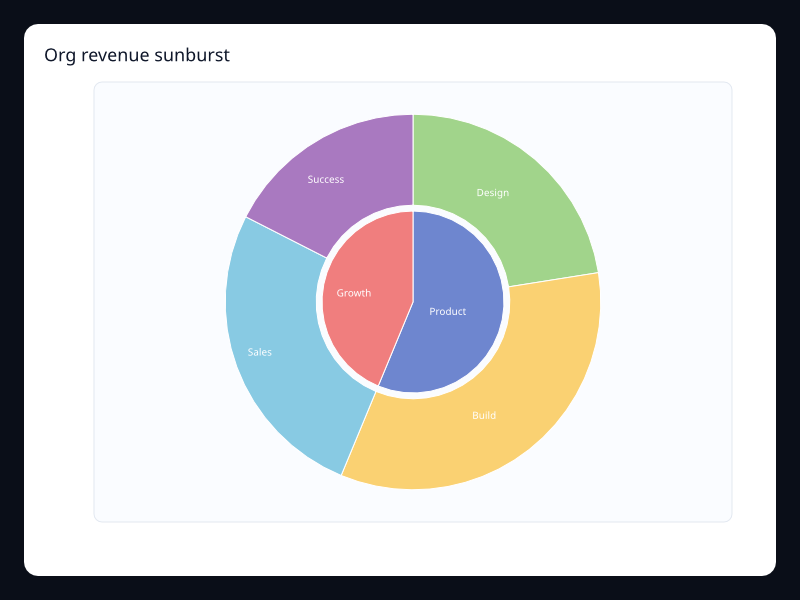
Org revenue sunburst uses Fission Charts typed Rust data to render a production-ready hierarchy view. Use it when hierarchy and whole composition both matter.
Data: Typed chart data, axes, and series.
Use when: Use it when hierarchy and whole composition both matter
Tags: sunburst
Channel mix river
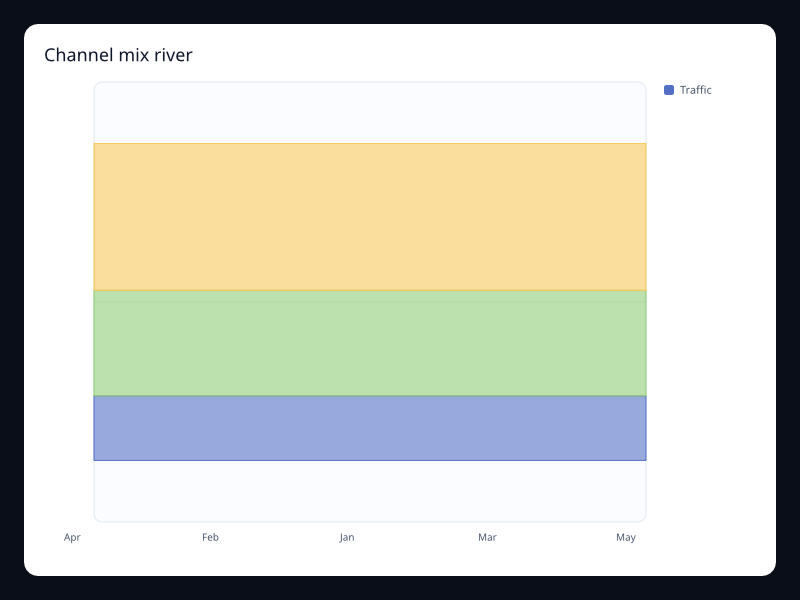
Channel mix river uses Fission Charts typed Rust data to render a production-ready hierarchy view. Use it to show mix changes without losing continuity.
Data: Typed chart data, axes, and series.
Use when: Use it to show mix changes without losing continuity
Tags: themeRiver
Support theme river
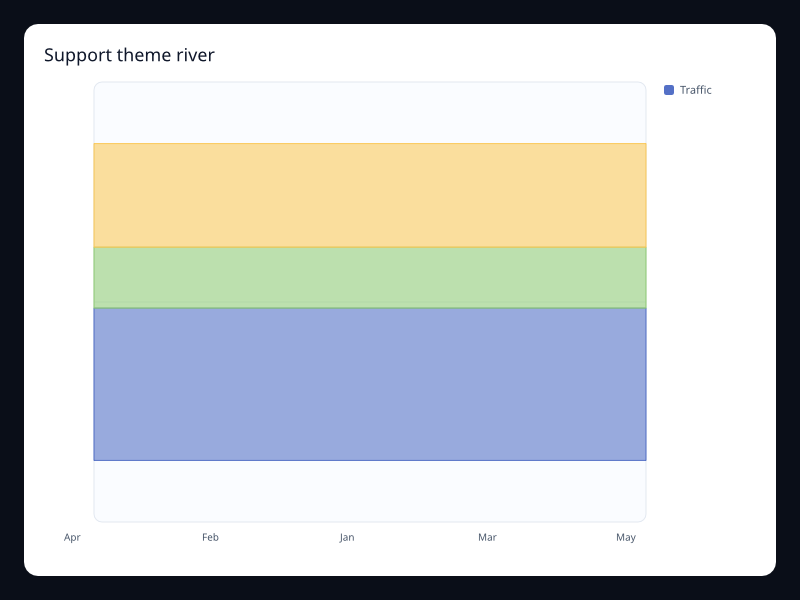
Support theme river uses Fission Charts typed Rust data to render a production-ready hierarchy view. Use it for shifting composition over time.
Data: Typed chart data, axes, and series.
Use when: Use it for shifting composition over time
Tags: themeRiver
File ownership tree
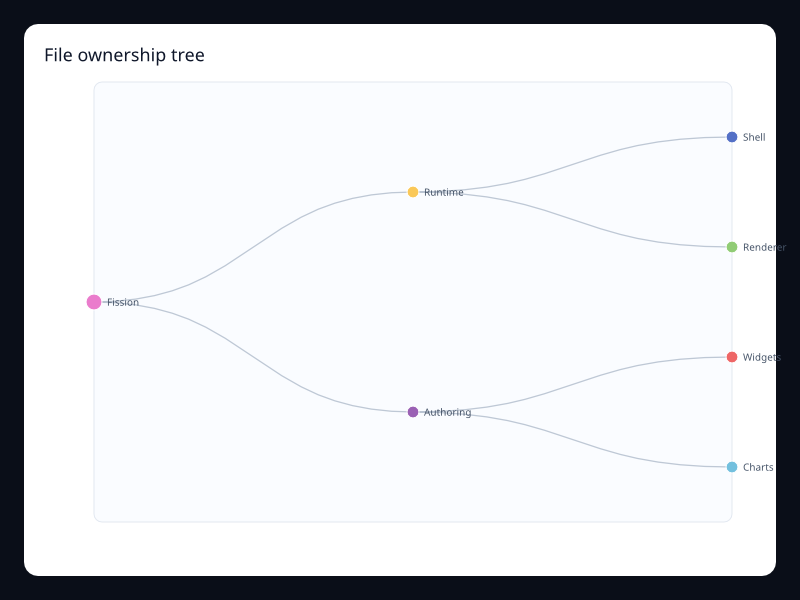
File ownership tree uses Fission Charts typed Rust data to render a production-ready hierarchy view. Use it for repository and ownership views.
Data: Typed chart data, axes, and series.
Use when: Use it for repository and ownership views
Tags: tree
Platform module tree
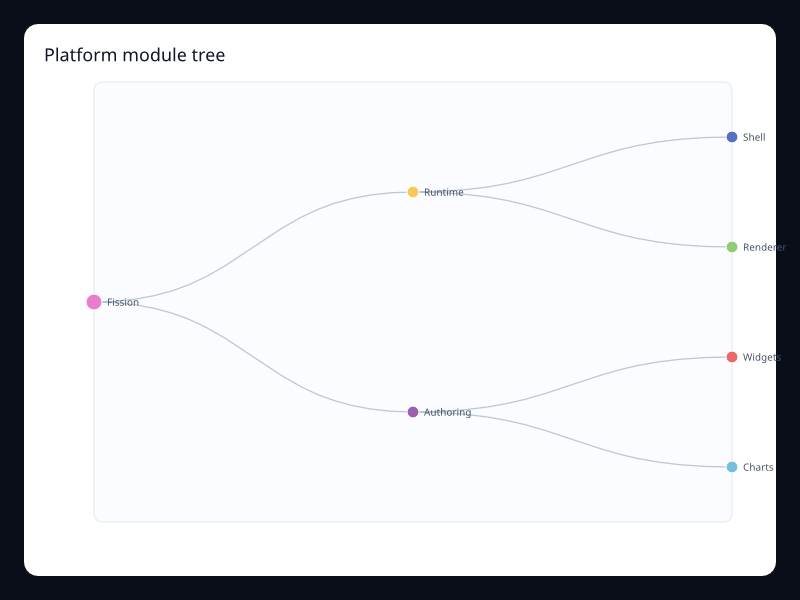
Platform module tree uses Fission Charts typed Rust data to render a production-ready hierarchy view. Use it for ownership and dependency hierarchy.
Data: Typed chart data, axes, and series.
Use when: Use it for ownership and dependency hierarchy
Tags: tree
Product taxonomy tree
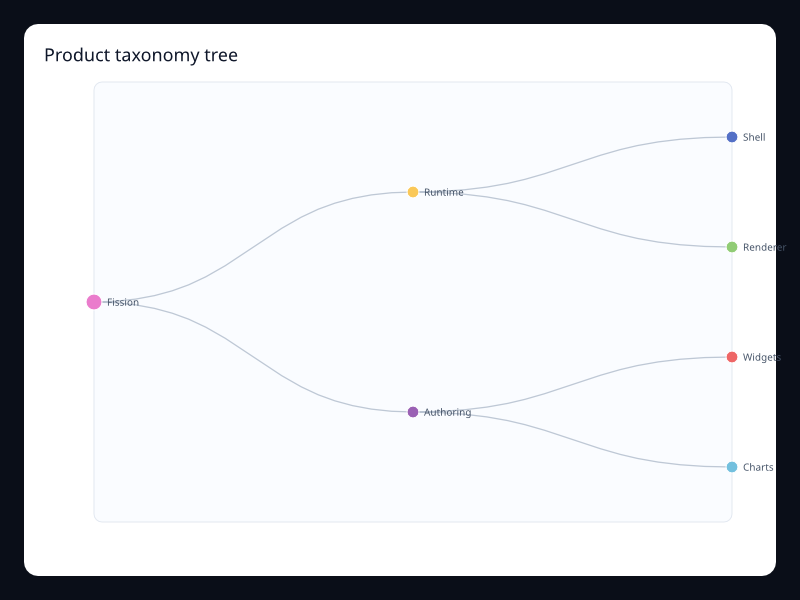
Product taxonomy tree uses Fission Charts typed Rust data to render a production-ready hierarchy view. Use it when users browse hierarchical structure.
Data: Typed chart data, axes, and series.
Use when: Use it when users browse hierarchical structure
Tags: tree
Radial service tree
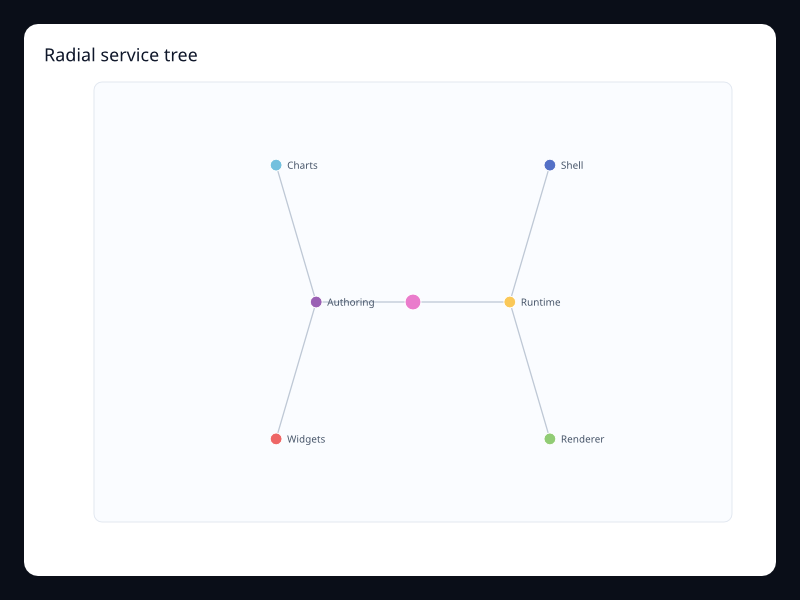
Radial service tree uses Fission Charts typed Rust data to render a production-ready hierarchy view. Use it when a compact hierarchy is needed.
Data: Typed chart data, axes, and series.
Use when: Use it when a compact hierarchy is needed
Tags: tree
Budget allocation treemap
Budget allocation treemap uses Fission Charts typed Rust data to render a production-ready hierarchy view. Use it for budget share exploration.
Data: Typed chart data, axes, and series.
Use when: Use it for budget share exploration
Tags: treemap
Cost center treemap
Cost center treemap uses Fission Charts typed Rust data to render a production-ready hierarchy view. Use it for part-to-whole hierarchy analysis.
Data: Typed chart data, axes, and series.
Use when: Use it for part-to-whole hierarchy analysis
Tags: treemap
Storage class treemap
Storage class treemap uses Fission Charts typed Rust data to render a production-ready hierarchy view. Use it when area should communicate magnitude.
Data: Typed chart data, axes, and series.
Use when: Use it when area should communicate magnitude
Tags: treemap
Hierarchy And Flow
Circular-like graph
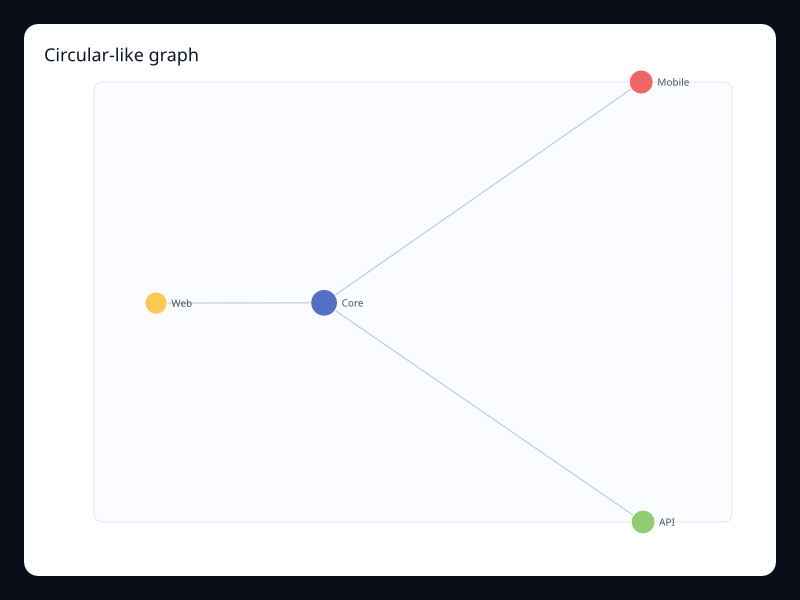
Network layout with larger central nodes. Use it for relationship overview surfaces.
Data: Typed chart data, axes, and series.
Use when: Use it for relationship overview surfaces
Tags: graph
Dependency graph
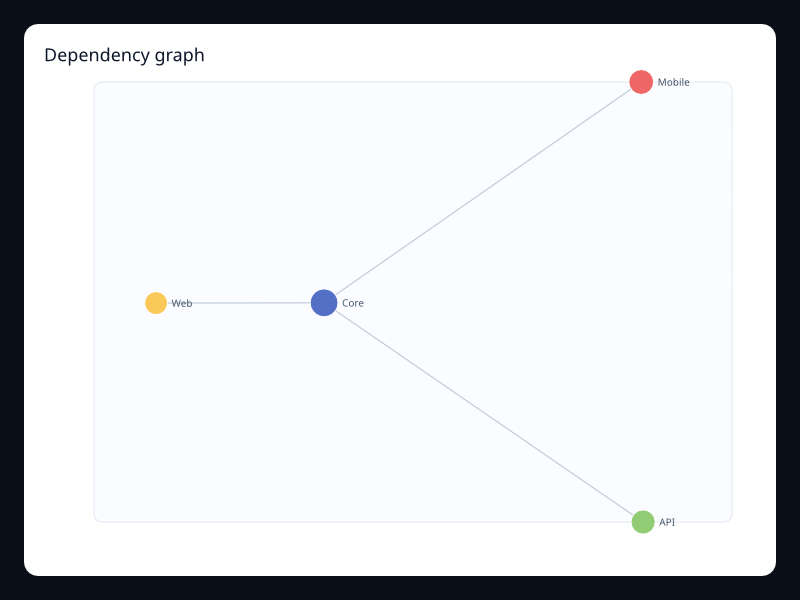
Network nodes and edges. Use it for dependency and topology diagrams.
Data: Typed chart data, axes, and series.
Use when: Use it for dependency and topology diagrams
Tags: graph
Service graph
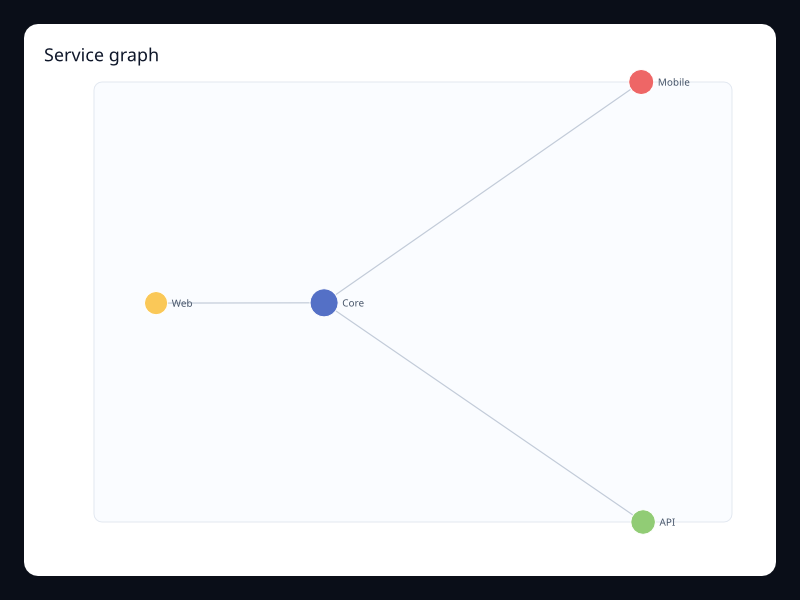
Service topology network. Use it for systems maps and service graphs.
Data: Typed chart data, axes, and series.
Use when: Use it for systems maps and service graphs
Tags: graph
Energy sankey
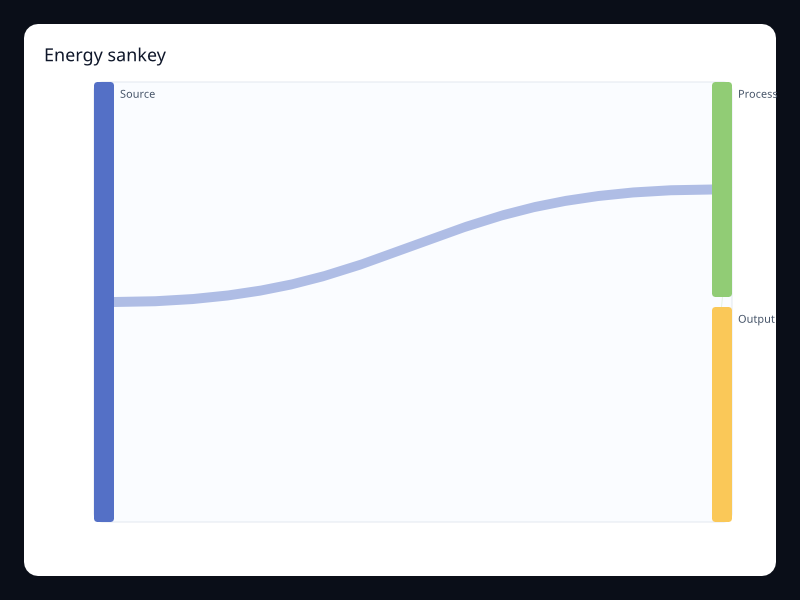
Flow bands between stages. Use it for material, energy, or revenue flow.
Data: Typed chart data, axes, and series.
Use when: Use it for material, energy, or revenue flow
Tags: sankey
User-flow sankey
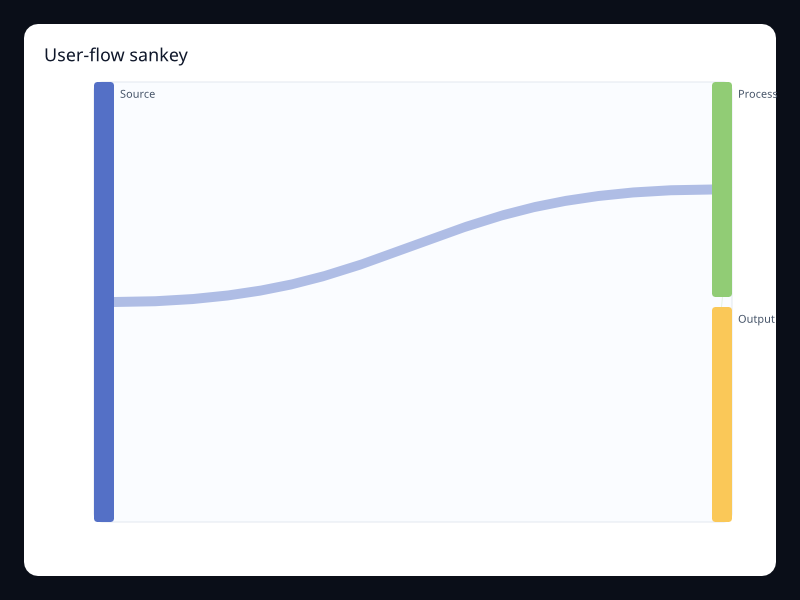
Sankey chart for user movement. Use it for conversion path analysis.
Data: Typed chart data, axes, and series.
Use when: Use it for conversion path analysis
Tags: sankey
Product sunburst
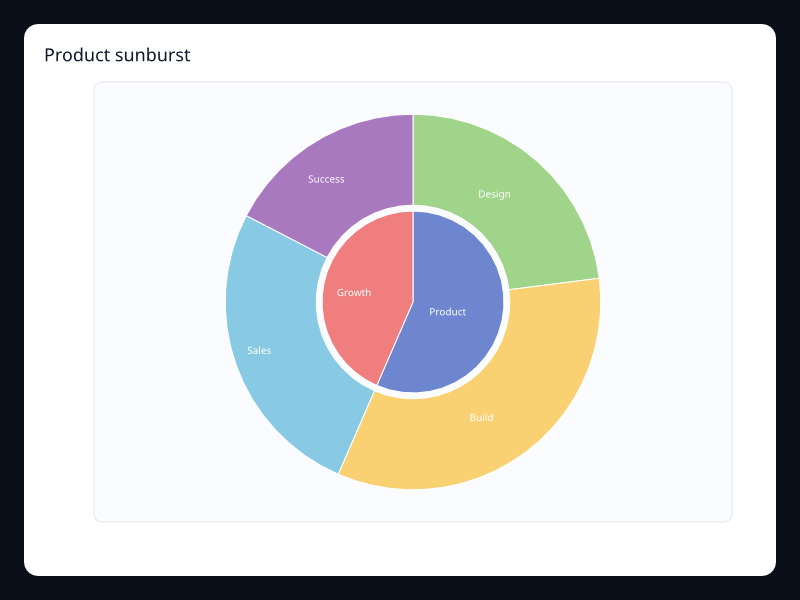
Hierarchical values in concentric rings. Use it for hierarchy depth and composition.
Data: Typed chart data, axes, and series.
Use when: Use it for hierarchy depth and composition
Tags: sunburst
Revenue sunburst
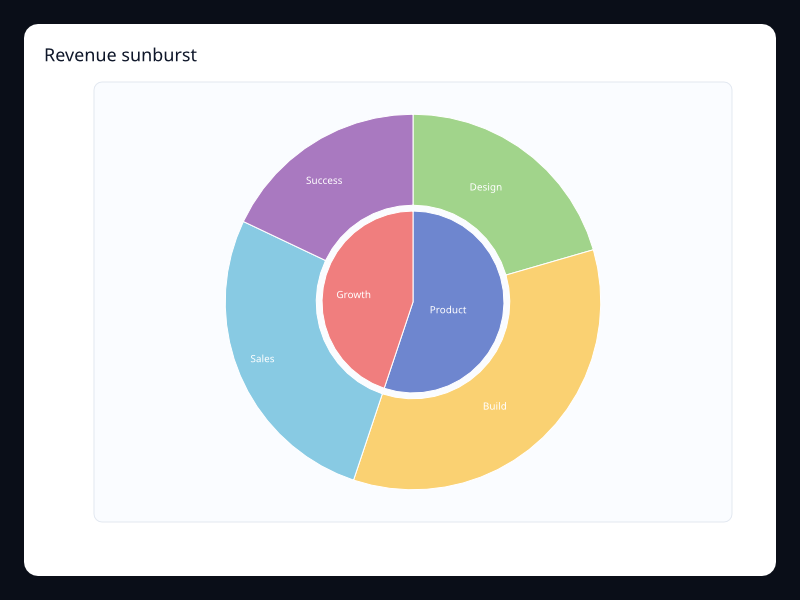
Revenue hierarchy as radial rings. Use it for nested part-to-whole data.
Data: Typed chart data, axes, and series.
Use when: Use it for nested part-to-whole data
Tags: sunburst
Demand theme river
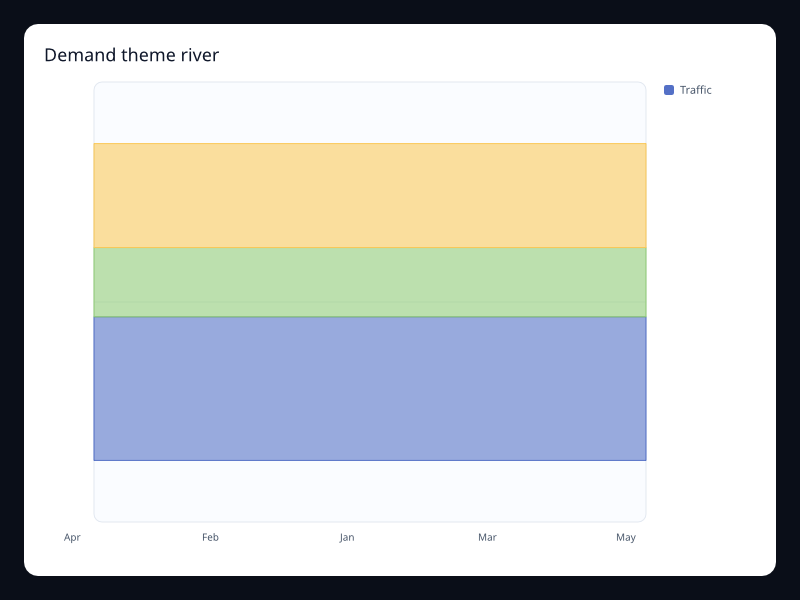
Theme river chart for demand sources. Use it for campaign or demand mix.
Data: Typed chart data, axes, and series.
Use when: Use it for campaign or demand mix
Tags: themeRiver
Traffic theme river
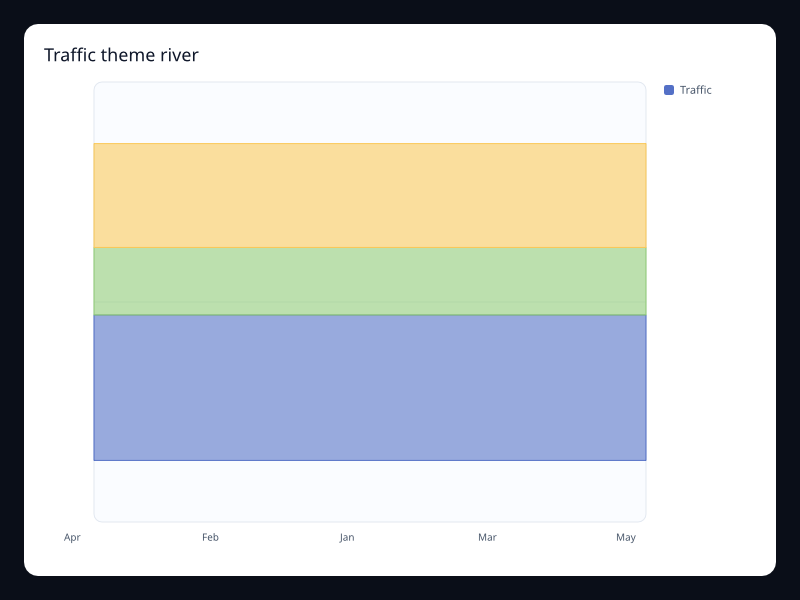
Flowing stacked categories over time. Use it for composition changing over time.
Data: Typed chart data, axes, and series.
Use when: Use it for composition changing over time
Tags: themeRiver
File-system tree
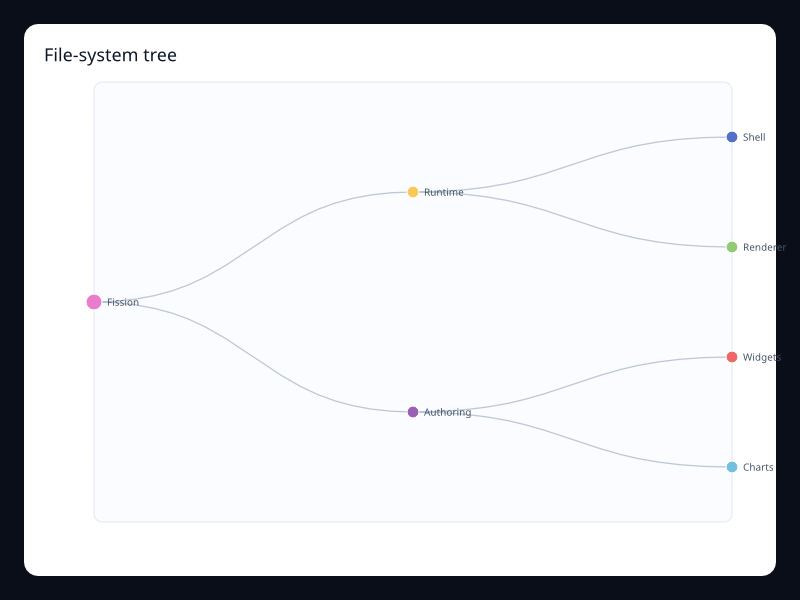
Nested file-style hierarchy. Use it for product and resource hierarchies.
Data: Typed chart data, axes, and series.
Use when: Use it for product and resource hierarchies
Tags: tree
Org tree
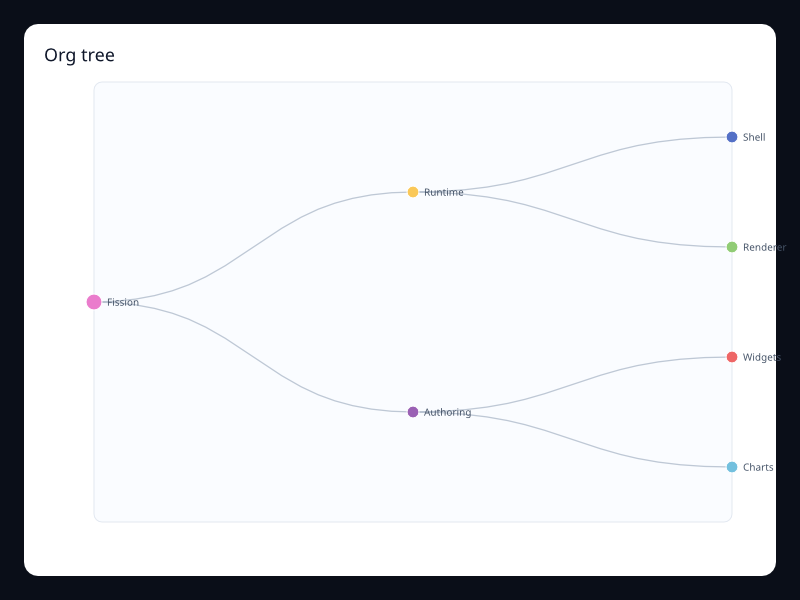
Parent-child hierarchy as a tidy tree. Use it for organization and ownership charts.
Data: Typed chart data, axes, and series.
Use when: Use it for organization and ownership charts
Tags: tree
Radial taxonomy
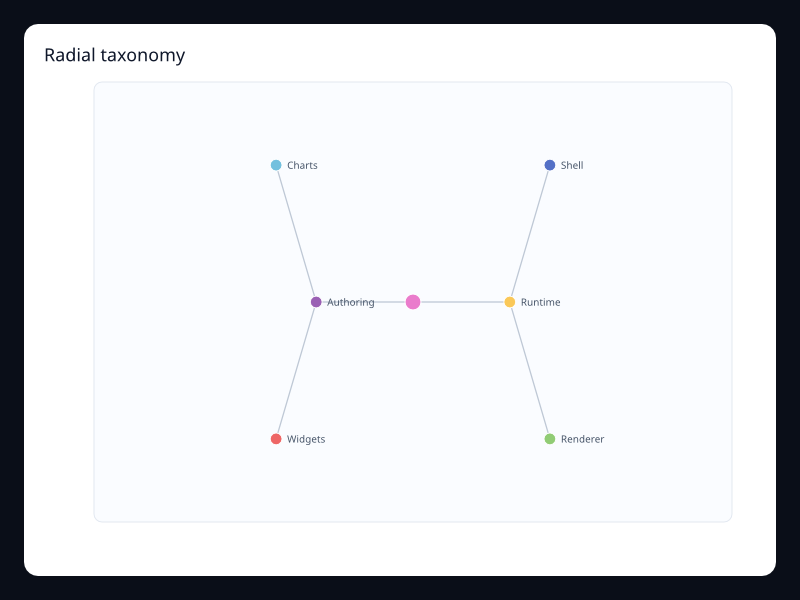
Radial layout for a shallow taxonomy. Use it when hierarchy symmetry matters.
Data: Typed chart data, axes, and series.
Use when: Use it when hierarchy symmetry matters
Tags: tree
Budget treemap
Hierarchical values packed into rectangles. Use it for budget or storage breakdowns.
Data: Typed chart data, axes, and series.
Use when: Use it for budget or storage breakdowns
Tags: treemap
Storage treemap
Treemap for storage allocation. Use it for disk and memory allocation.
Data: Typed chart data, axes, and series.
Use when: Use it for disk and memory allocation
Tags: treemap
Interaction
Annotation callout
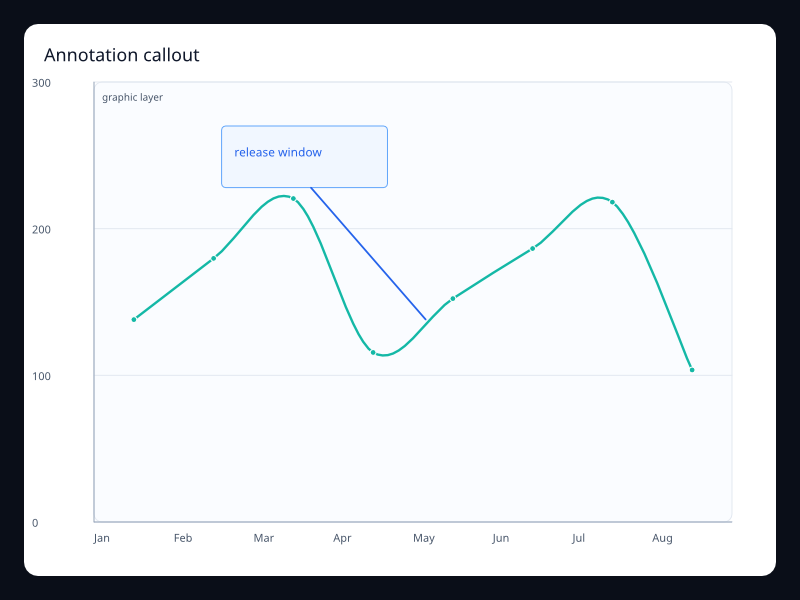
Annotation callout uses Fission Charts typed Rust data to render a production-ready interaction view. Use it for guided dashboards and reports.
Data: Typed chart data, axes, and series.
Use when: Use it for guided dashboards and reports
Tags: graphic
Brush outliers
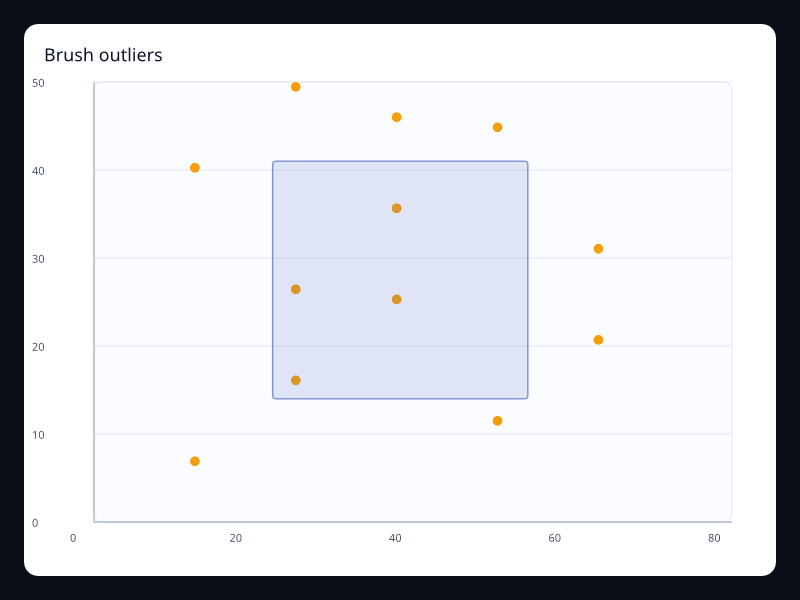
Brush outliers uses Fission Charts typed Rust data to render a production-ready interaction view. Use it for exploratory selection.
Data: Typed chart data, axes, and series.
Use when: Use it for exploratory selection
Tags: brush
Brush region
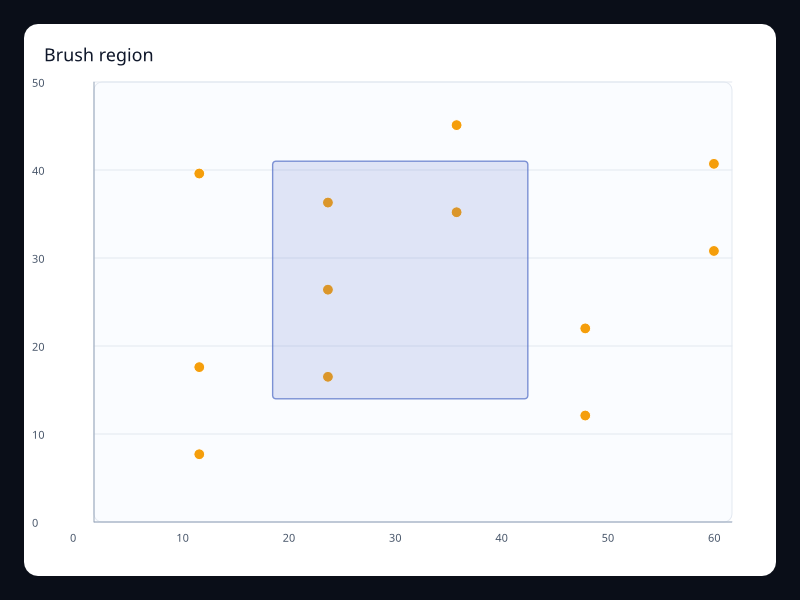
Brush region uses Fission Charts typed Rust data to render a production-ready interaction view. Use it when users select data before drilling in.
Data: Typed chart data, axes, and series.
Use when: Use it when users select data before drilling in
Tags: brush
Data zoom overview
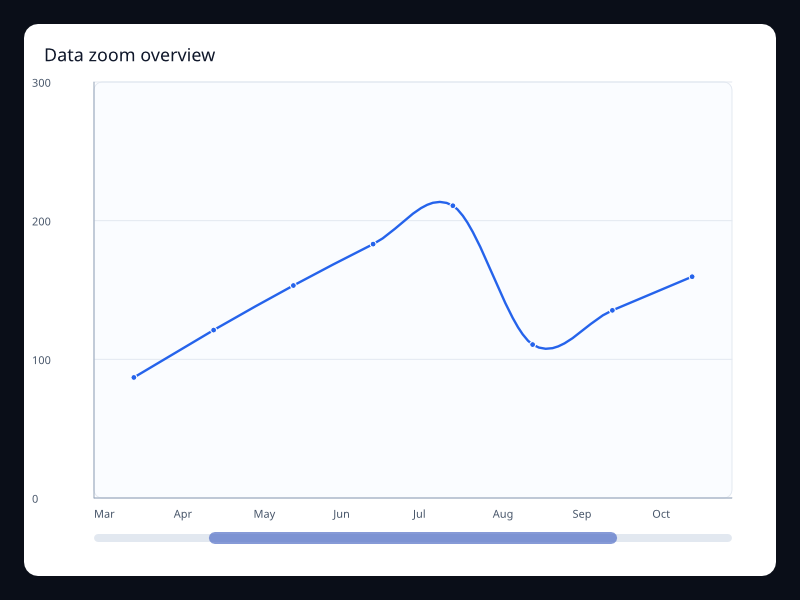
Data zoom overview uses Fission Charts typed Rust data to render a production-ready interaction view. Use it for long series where one window is active.
Data: Typed chart data, axes, and series.
Use when: Use it for long series where one window is active
Tags: dataZoom
Telemetry zoom
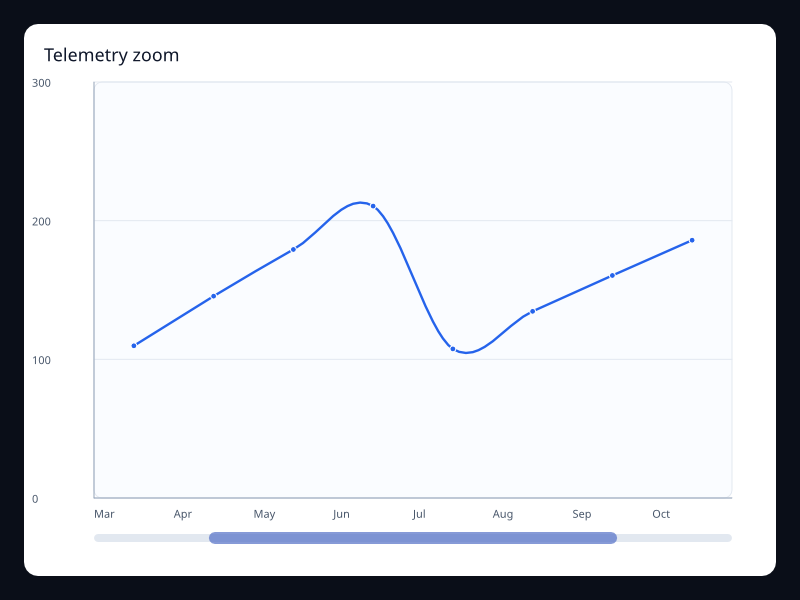
Telemetry zoom uses Fission Charts typed Rust data to render a production-ready interaction view. Use it for monitoring and investigation.
Data: Typed chart data, axes, and series.
Use when: Use it for monitoring and investigation
Tags: dataZoom
Graphic band
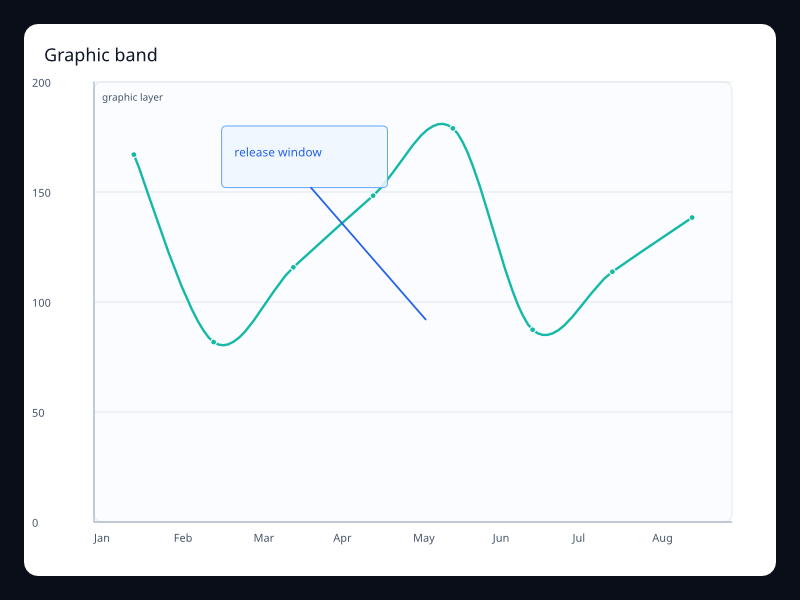
Graphic band uses Fission Charts typed Rust data to render a production-ready interaction view. Use it for callouts and shaded product ranges.
Data: Typed chart data, axes, and series.
Use when: Use it for callouts and shaded product ranges
Tags: graphic
Graphic note
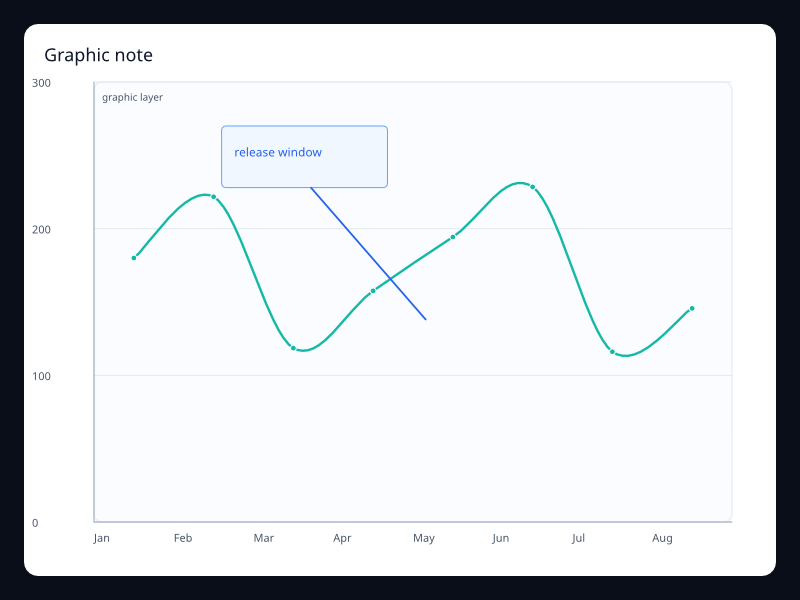
Graphic note uses Fission Charts typed Rust data to render a production-ready interaction view. Use it to add explanations without leaving the chart model.
Data: Typed chart data, axes, and series.
Use when: Use it to add explanations without leaving the chart model
Tags: graphic
Breach mark area
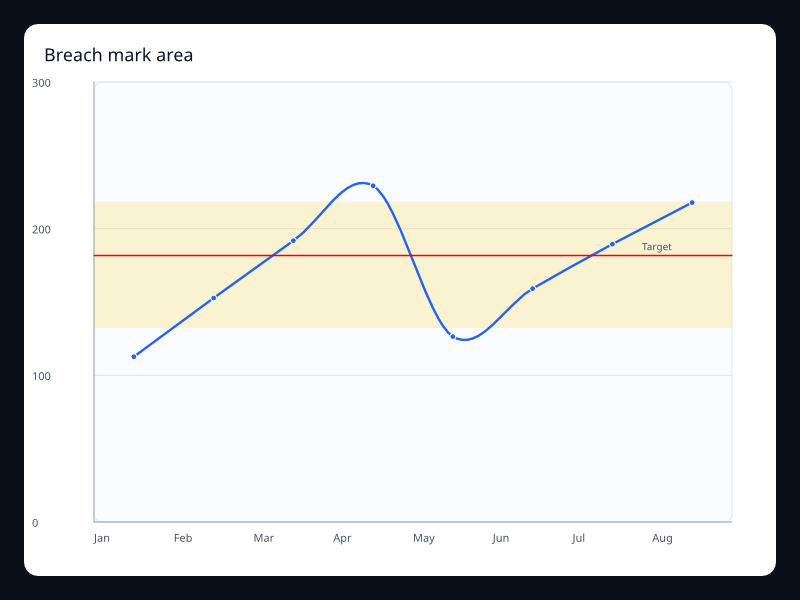
Breach mark area uses Fission Charts typed Rust data to render a production-ready interaction view. Use it when unsafe ranges need visible boundaries.
Data: Typed chart data, axes, and series.
Use when: Use it when unsafe ranges need visible boundaries
Tags: markArea
Deployment marks
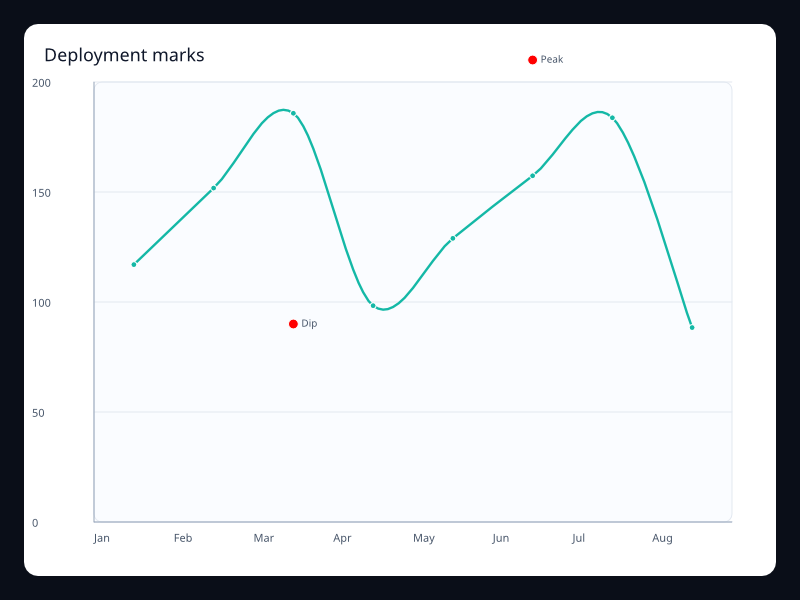
Deployment marks uses Fission Charts typed Rust data to render a production-ready interaction view. Use it when specific moments explain the data.
Data: Typed chart data, axes, and series.
Use when: Use it when specific moments explain the data
Tags: markPoint
Marked SLO chart
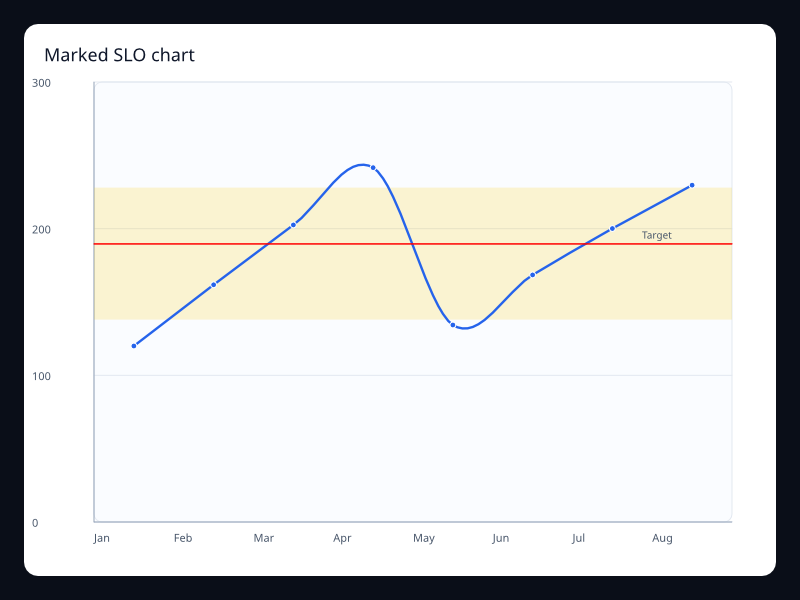
Marked SLO chart uses Fission Charts typed Rust data to render a production-ready interaction view. Use it to keep thresholds in the chart instead of external notes.
Data: Typed chart data, axes, and series.
Use when: Use it to keep thresholds in the chart instead of external notes
Tags: markLine
Selectable scatter
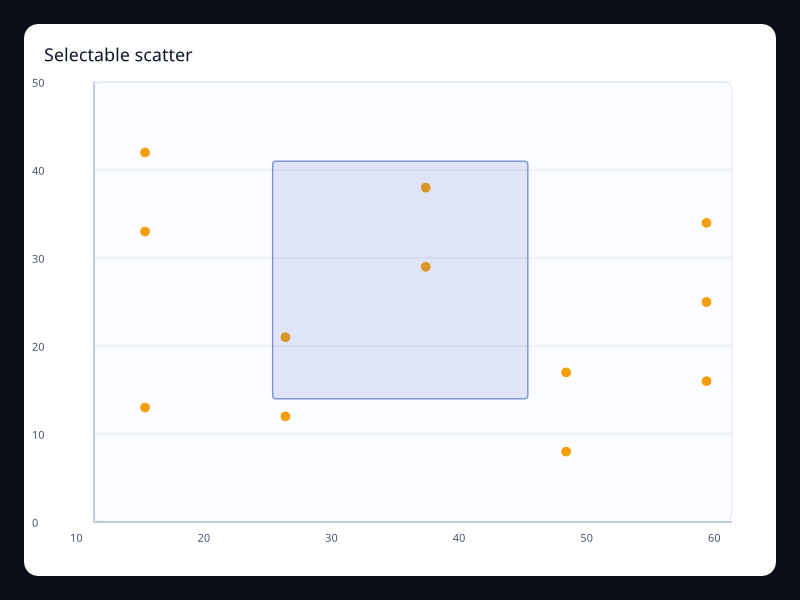
Selectable scatter uses Fission Charts typed Rust data to render a production-ready interaction view. Use it when users inspect clusters interactively.
Data: Typed chart data, axes, and series.
Use when: Use it when users inspect clusters interactively
Tags: brush
Capacity timeline
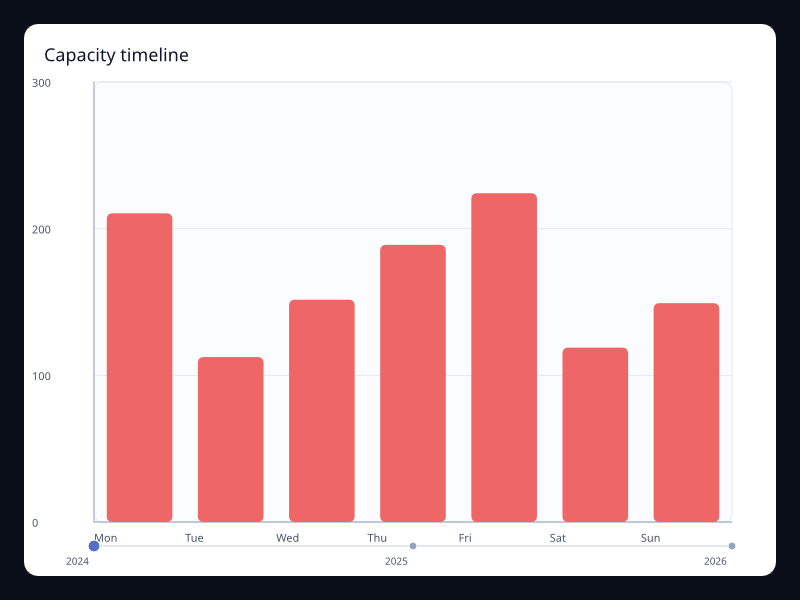
Capacity timeline uses Fission Charts typed Rust data to render a production-ready interaction view. Use it for capacity changes across time.
Data: Typed chart data, axes, and series.
Use when: Use it for capacity changes across time
Tags: timeline
Timeline releases
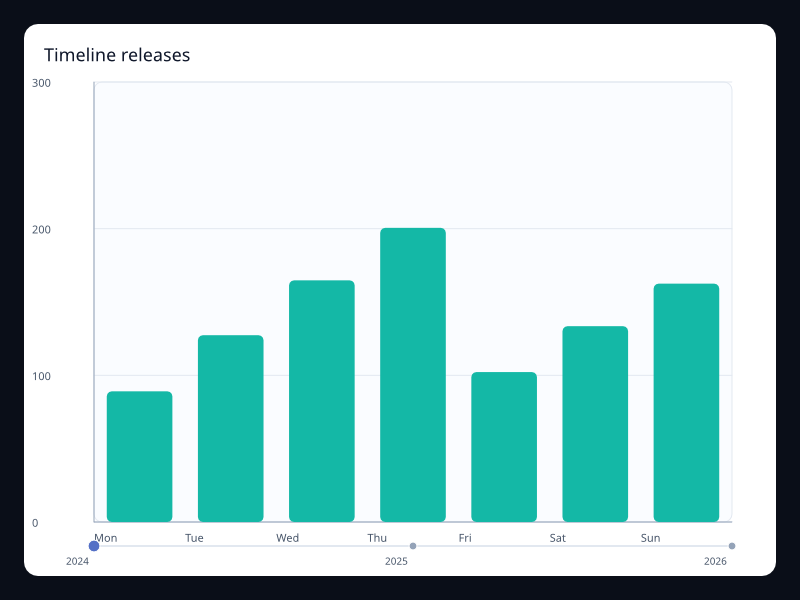
Timeline releases uses Fission Charts typed Rust data to render a production-ready interaction view. Use it for versioned or period-based views.
Data: Typed chart data, axes, and series.
Use when: Use it for versioned or period-based views
Tags: timeline
Timeline years
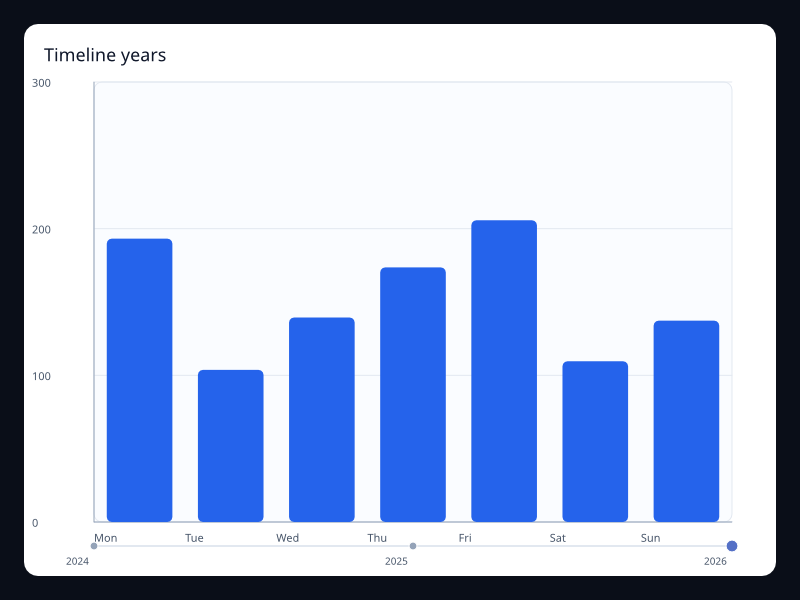
Timeline years uses Fission Charts typed Rust data to render a production-ready interaction view. Use it when the same view switches between periods.
Data: Typed chart data, axes, and series.
Use when: Use it when the same view switches between periods
Tags: timeline
Analysis toolbox
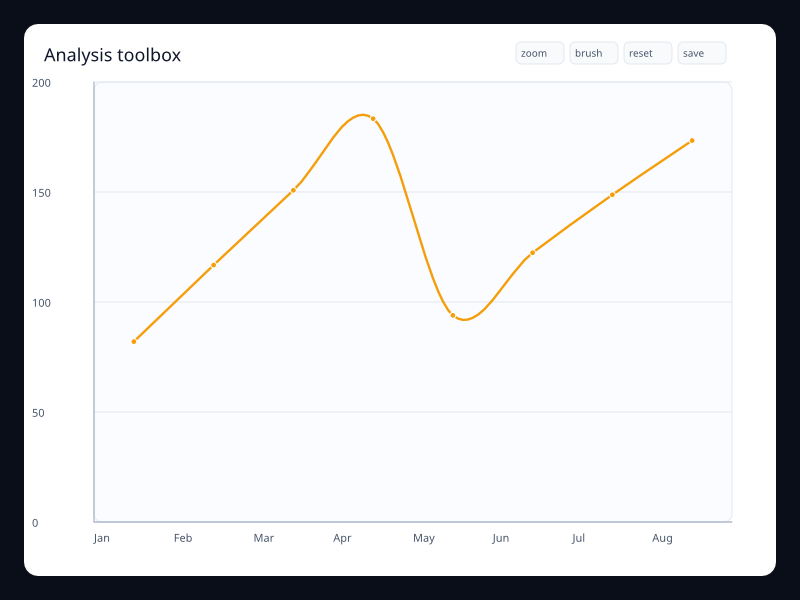
Analysis toolbox uses Fission Charts typed Rust data to render a production-ready interaction view. Use it when analysis actions belong close to the chart.
Data: Typed chart data, axes, and series.
Use when: Use it when analysis actions belong close to the chart
Tags: toolbox
Export toolbox
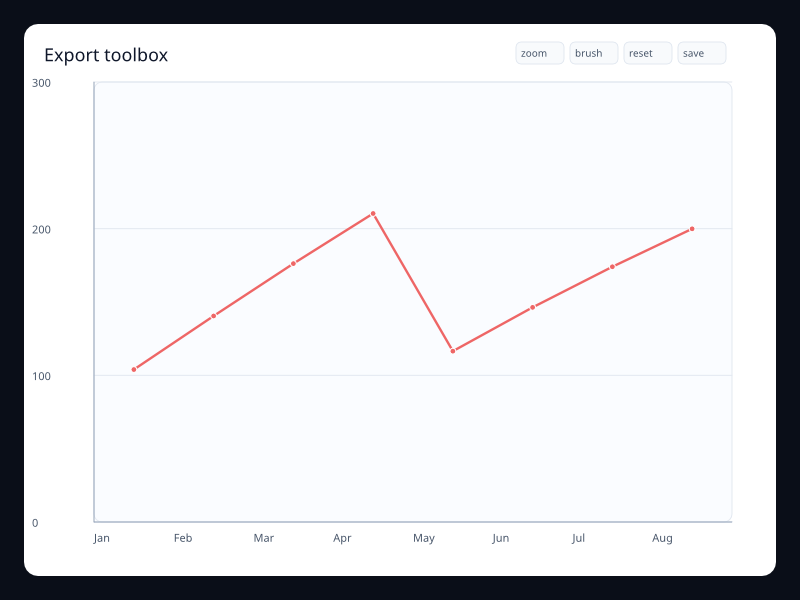
Export toolbox uses Fission Charts typed Rust data to render a production-ready interaction view. Use it when chart controls need a consistent built-in place.
Data: Typed chart data, axes, and series.
Use when: Use it when chart controls need a consistent built-in place
Tags: toolbox
Restore toolbox
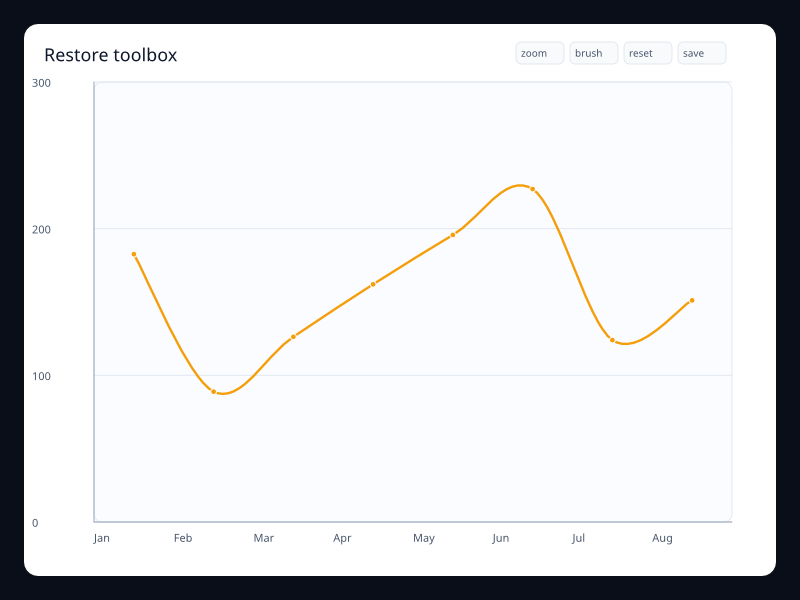
Restore toolbox uses Fission Charts typed Rust data to render a production-ready interaction view. Use it when user exploration needs a safe reset.
Data: Typed chart data, axes, and series.
Use when: Use it when user exploration needs a safe reset
Tags: toolbox
Axis tooltip
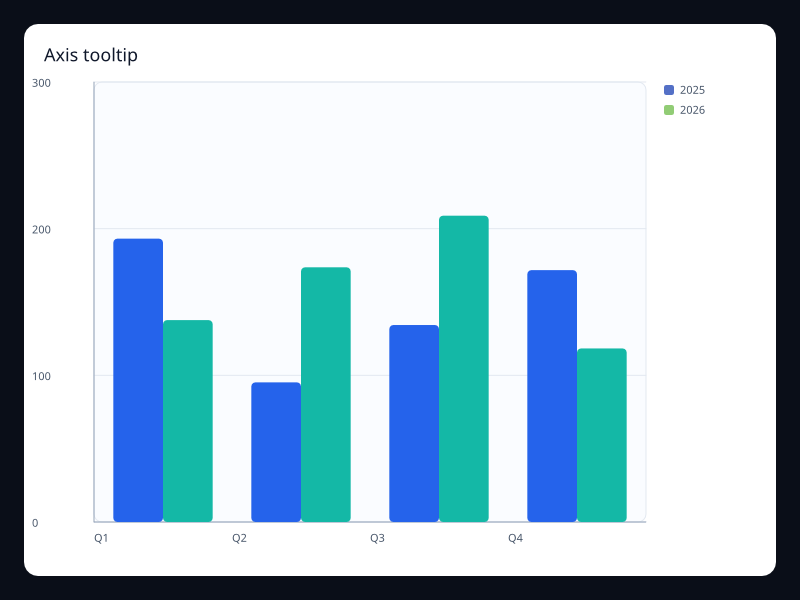
Axis tooltip uses Fission Charts typed Rust data to render a production-ready interaction view. Use it when the whole axis position is the hover target.
Data: Typed chart data, axes, and series.
Use when: Use it when the whole axis position is the hover target
Tags: tooltip
Grouped tooltip
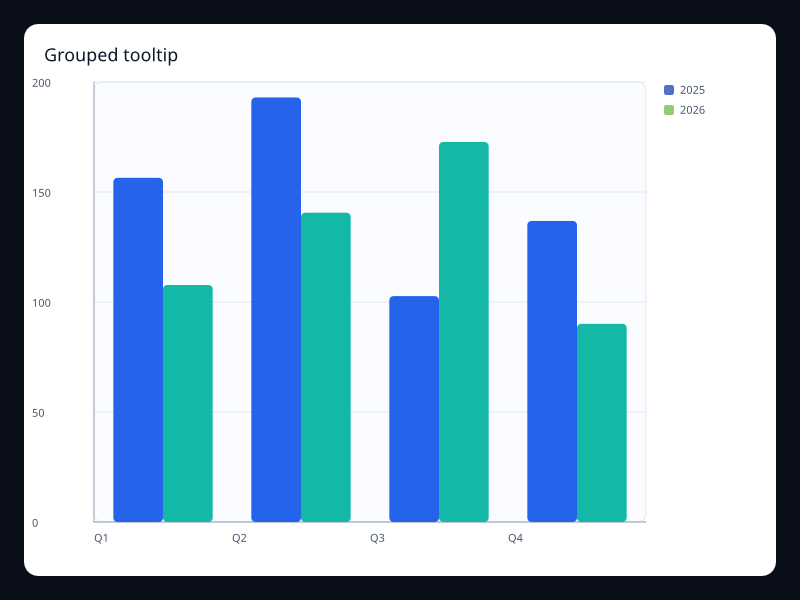
Grouped tooltip uses Fission Charts typed Rust data to render a production-ready interaction view. Use it when comparison needs hover detail.
Data: Typed chart data, axes, and series.
Use when: Use it when comparison needs hover detail
Tags: tooltip
Item tooltip
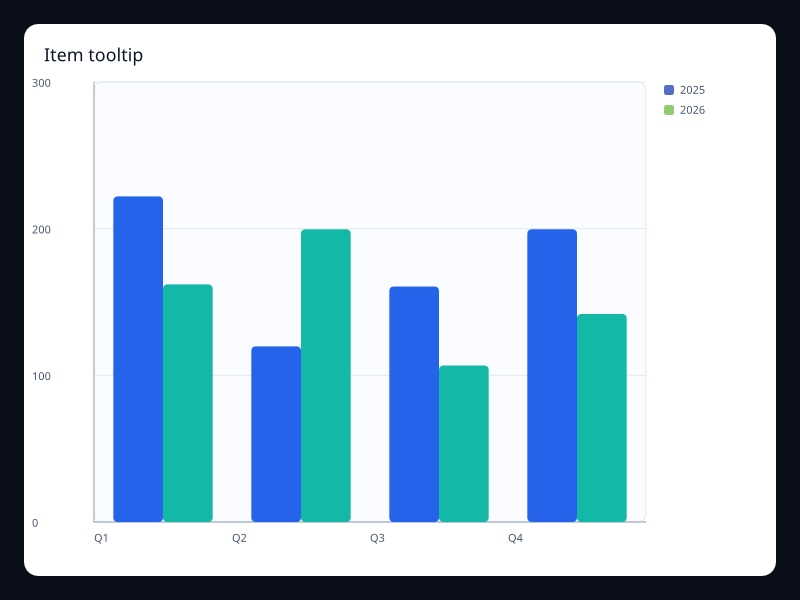
Item tooltip uses Fission Charts typed Rust data to render a production-ready interaction view. Use it when individual marks carry detail.
Data: Typed chart data, axes, and series.
Use when: Use it when individual marks carry detail
Tags: tooltip
Line
Alert annotations
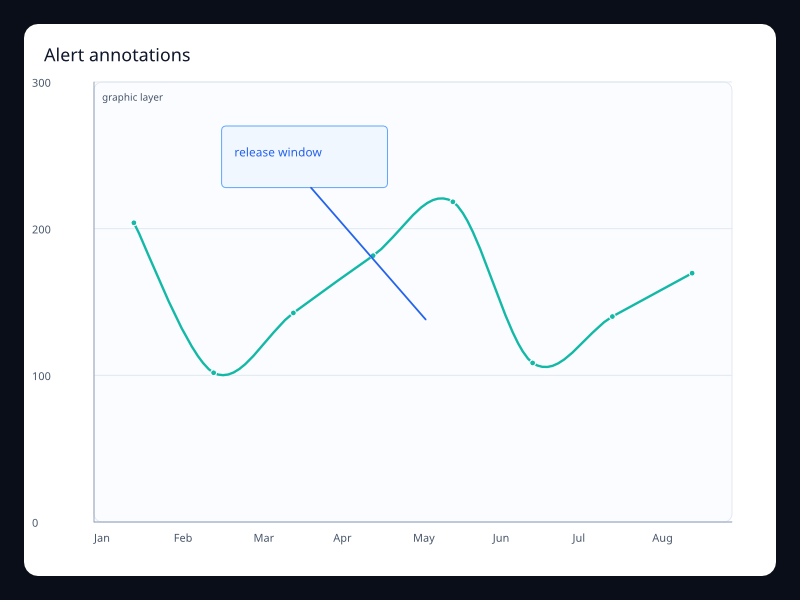
Alert annotations uses Fission Charts typed Rust data to render a production-ready line view. Use it when incidents or milestones need to stay attached to the trend.
Data: Typed chart data, axes, and series.
Use when: Use it when incidents or milestones need to stay attached to the trend
Tags: line
Line with alert events
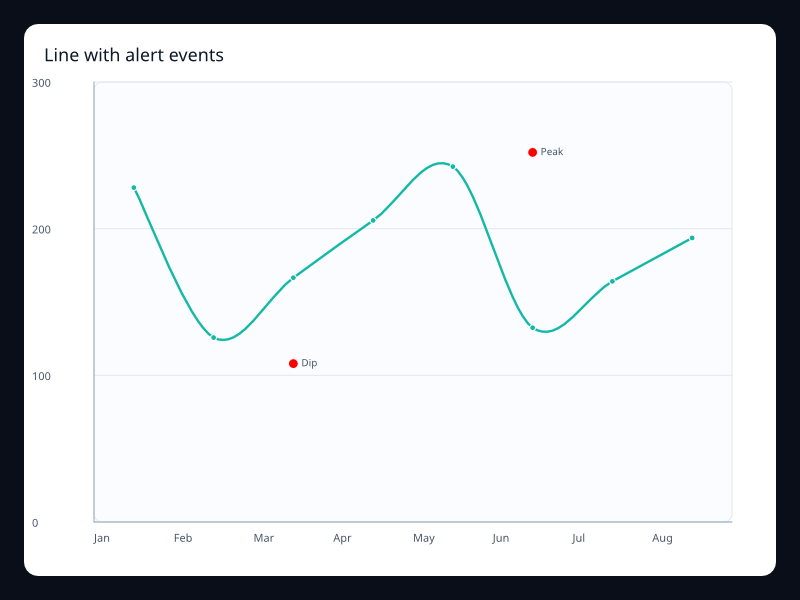
Line chart with named event points. Use it to label incidents or releases on a metric.
Data: Typed chart data, axes, and series.
Use when: Use it to label incidents or releases on a metric
Tags: line
Annotated line
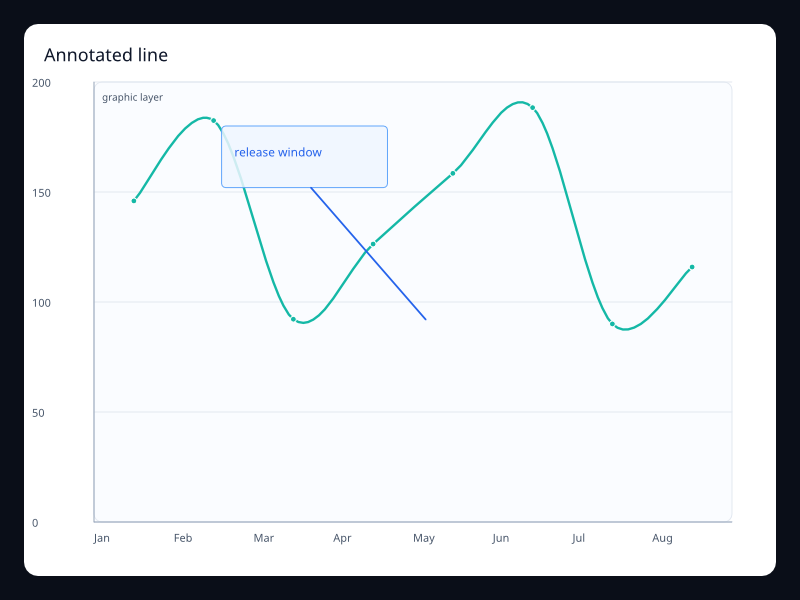
Line chart with a callout annotation in the plot area. Use it to explain a visible change directly on the chart.
Data: Typed chart data, axes, and series.
Use when: Use it to explain a visible change directly on the chart
Tags: line
API throughput line
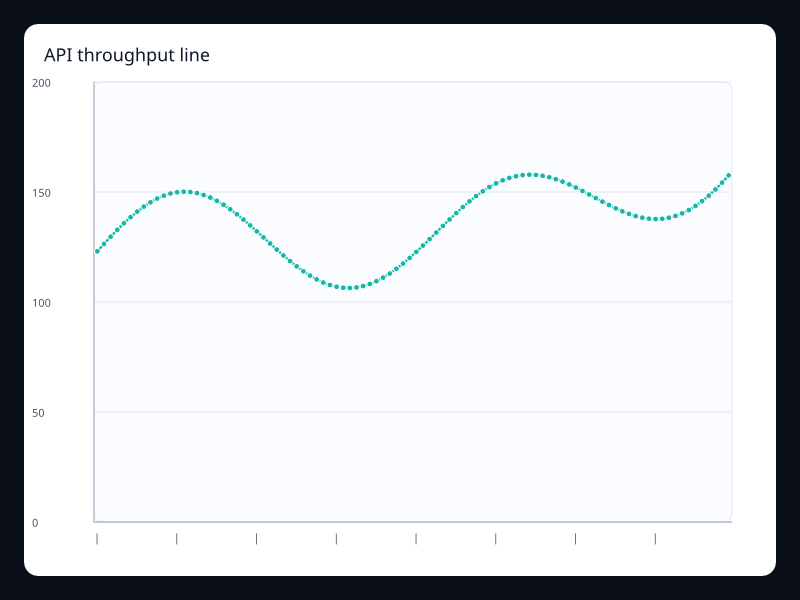
API throughput line uses Fission Charts typed Rust data to render a production-ready line view. Use it for telemetry panels with many points.
Data: Typed chart data, axes, and series.
Use when: Use it for telemetry panels with many points
Tags: line
Capacity forecast band
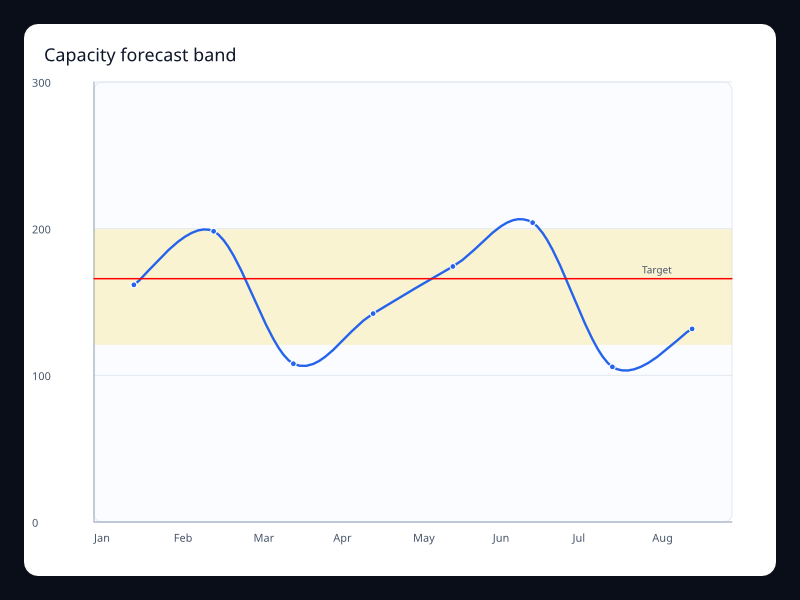
Capacity forecast band uses Fission Charts typed Rust data to render a production-ready line view. Use it when a forecast needs both the line and the safe range.
Data: Typed chart data, axes, and series.
Use when: Use it when a forecast needs both the line and the safe range
Tags: line
Conversion stack area
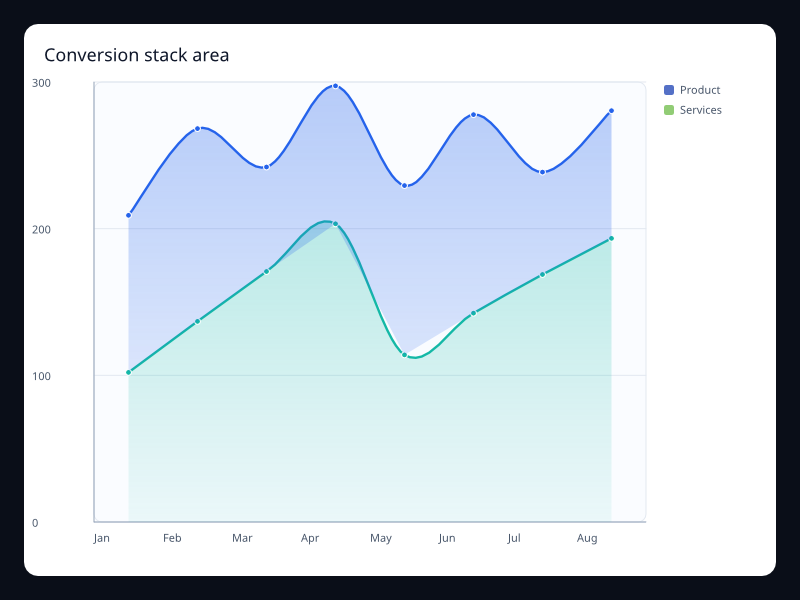
Conversion stack area uses Fission Charts typed Rust data to render a production-ready line view. Use it to explain how categories make up a total over time.
Data: Typed chart data, axes, and series.
Use when: Use it to explain how categories make up a total over time
Tags: area
Demand sparkline
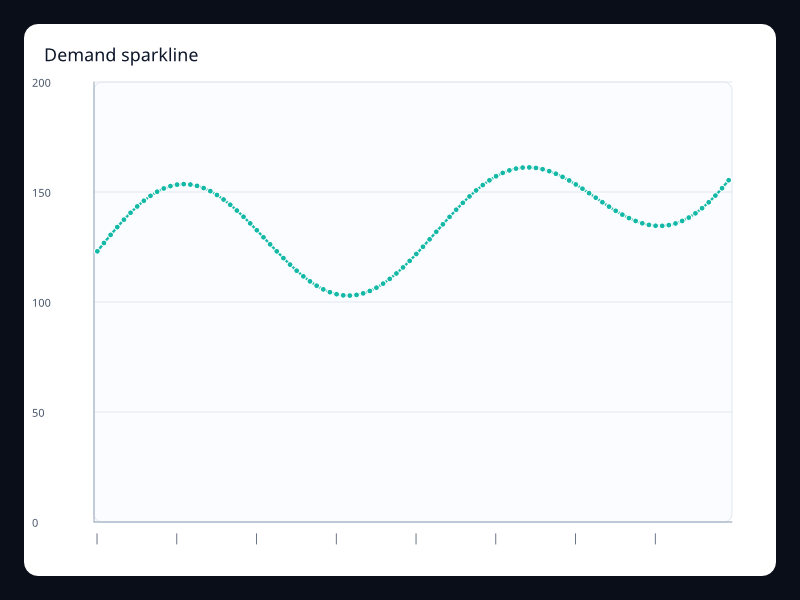
Demand sparkline uses Fission Charts typed Rust data to render a production-ready line view. Use it inside dense dashboard cards.
Data: Typed chart data, axes, and series.
Use when: Use it inside dense dashboard cards
Tags: line
Deployment event line
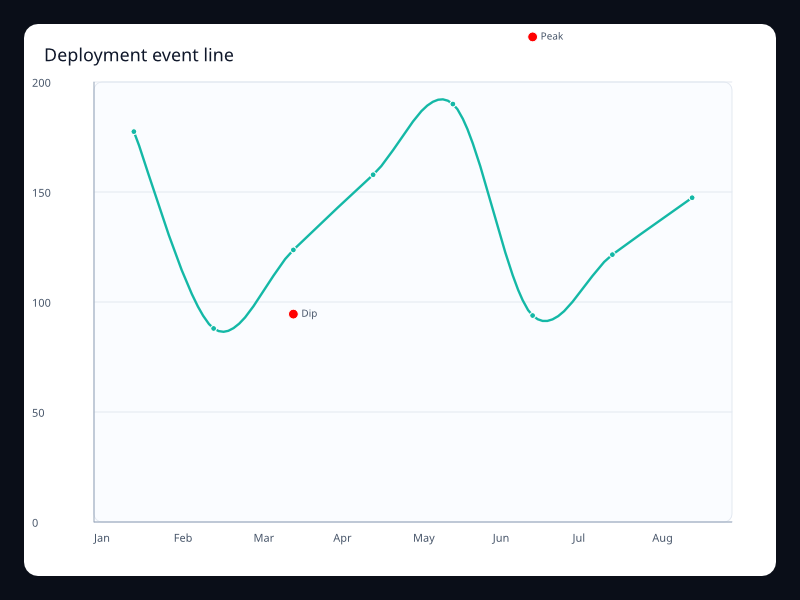
Deployment event line uses Fission Charts typed Rust data to render a production-ready line view. Use it to connect product changes to metric movement.
Data: Typed chart data, axes, and series.
Use when: Use it to connect product changes to metric movement
Tags: line
Dual line comparison
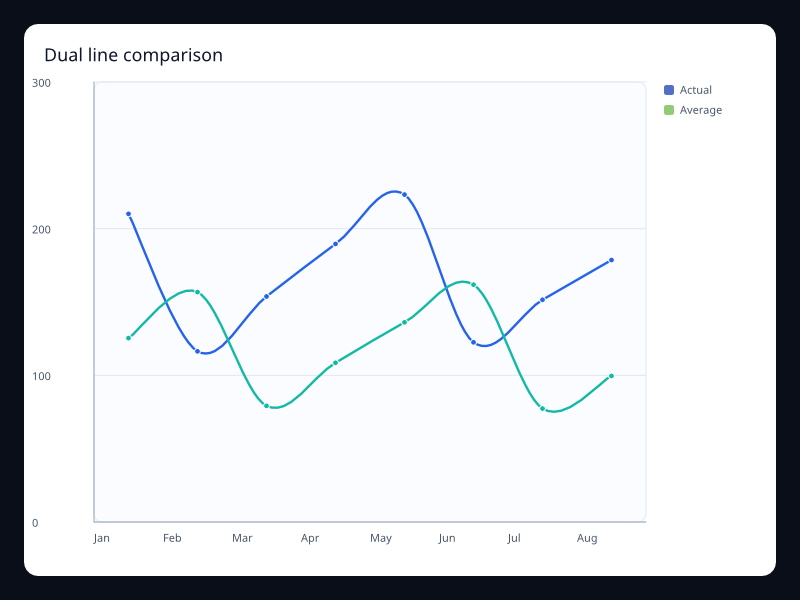
Two related line series sharing one chart. Use it to compare two trends without changing units.
Data: Typed chart data, axes, and series.
Use when: Use it to compare two trends without changing units
Tags: line
Error budget burn
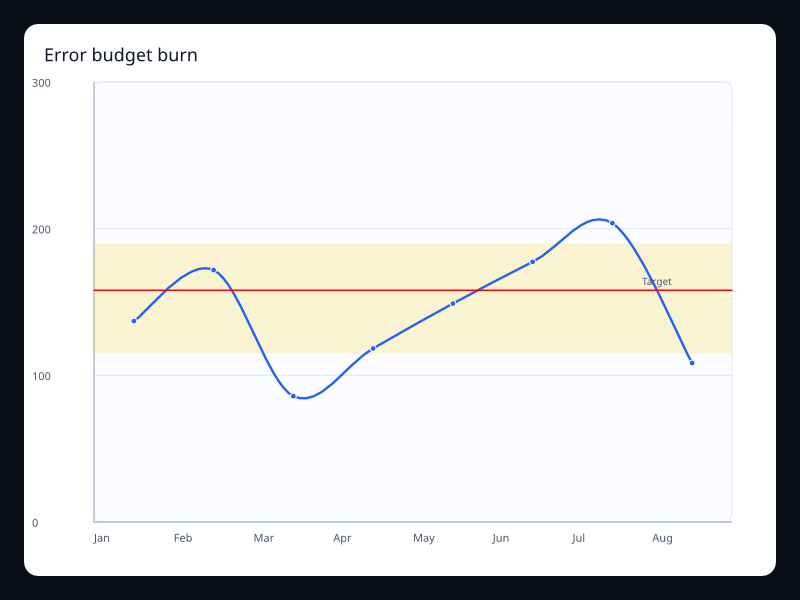
Error budget burn uses Fission Charts typed Rust data to render a production-ready line view. Use it when teams need to see whether a service is inside its operating band.
Data: Typed chart data, axes, and series.
Use when: Use it when teams need to see whether a service is inside its operating band
Tags: line
Forecast band
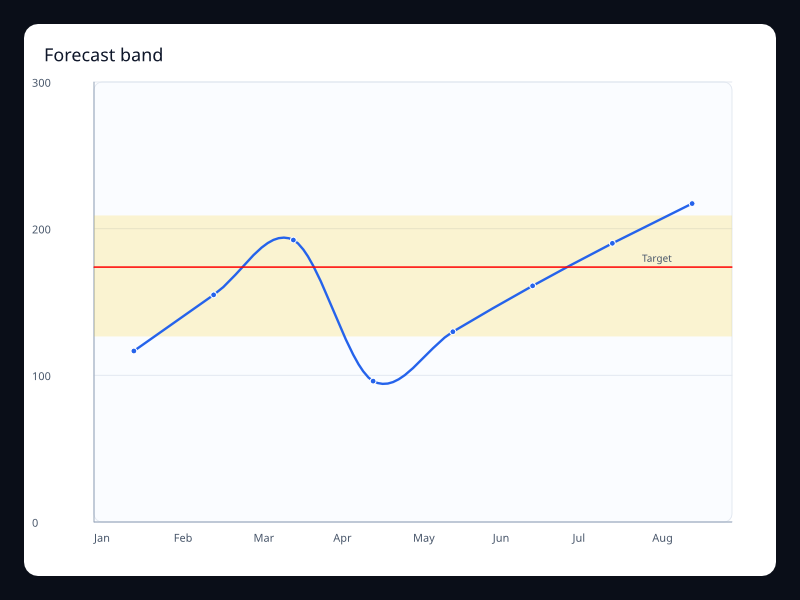
Line chart with an expected range behind the observed values. Use it when forecasts need uncertainty context.
Data: Typed chart data, axes, and series.
Use when: Use it when forecasts need uncertainty context
Tags: line
Gradient area line
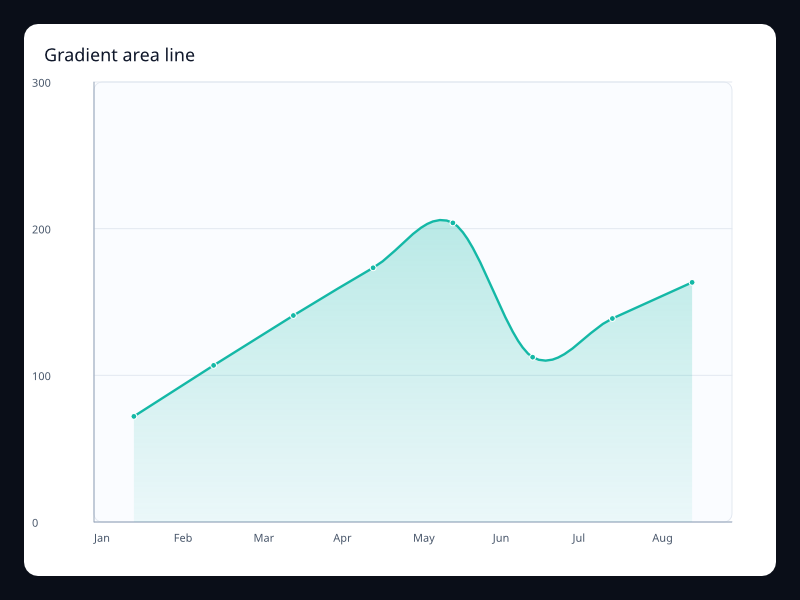
Line chart with translucent area fill for volume emphasis. Use it when magnitude and trend should be read together.
Data: Typed chart data, axes, and series.
Use when: Use it when magnitude and trend should be read together
Tags: line
Inventory end-step
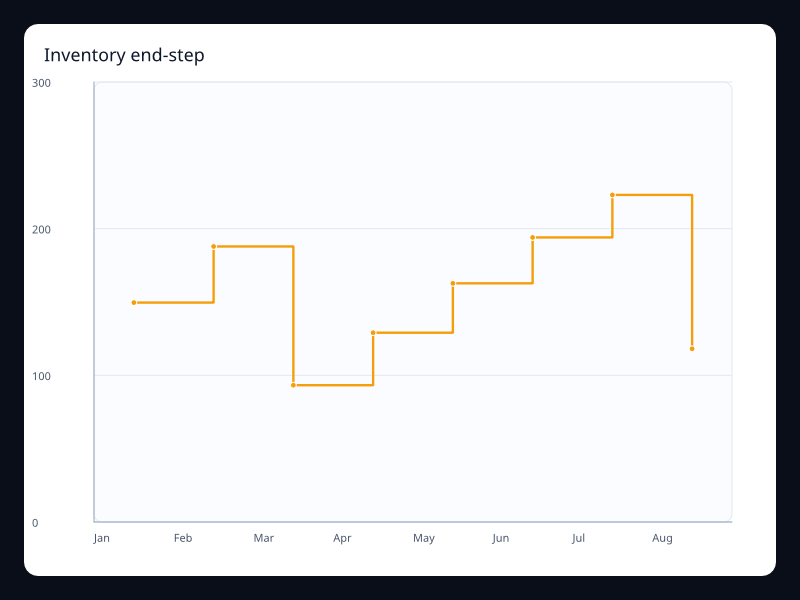
Inventory end-step uses Fission Charts typed Rust data to render a production-ready line view. Use it when the value changes after the period closes.
Data: Typed chart data, axes, and series.
Use when: Use it when the value changes after the period closes
Tags: line
Log-shaped line
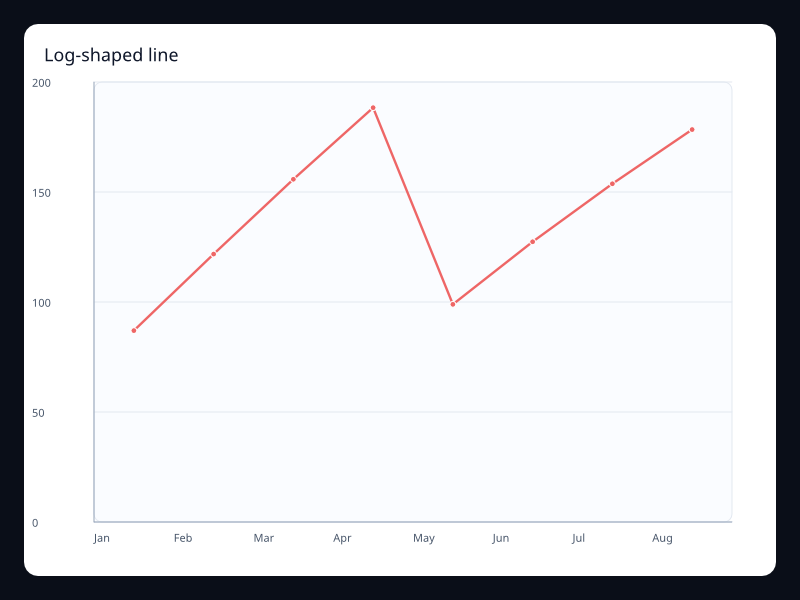
A line with rapid early growth and slower later growth. Use it for adoption curves and saturation effects.
Data: Typed chart data, axes, and series.
Use when: Use it for adoption curves and saturation effects
Tags: line
Market index line
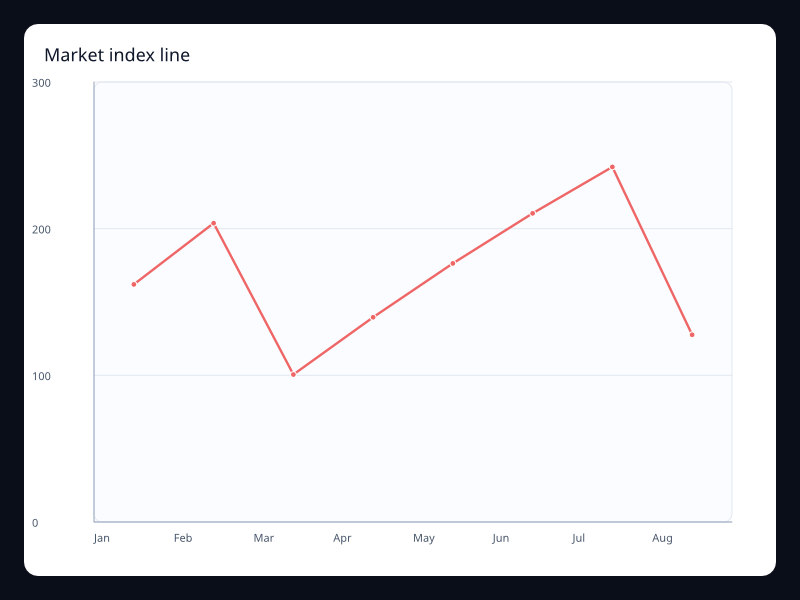
Market index line uses Fission Charts typed Rust data to render a production-ready line view. Use it when direction and volatility matter more than individual samples.
Data: Typed chart data, axes, and series.
Use when: Use it when direction and volatility matter more than individual samples
Tags: line
Min/max band
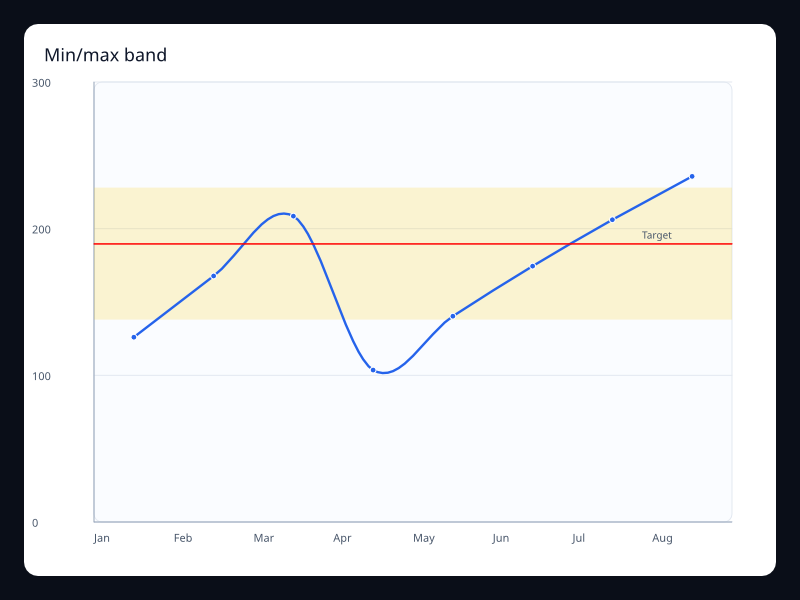
Trend line with upper and lower guide marks. Use it to show expected bounds around a metric.
Data: Typed chart data, axes, and series.
Use when: Use it to show expected bounds around a metric
Tags: line
Operational step series
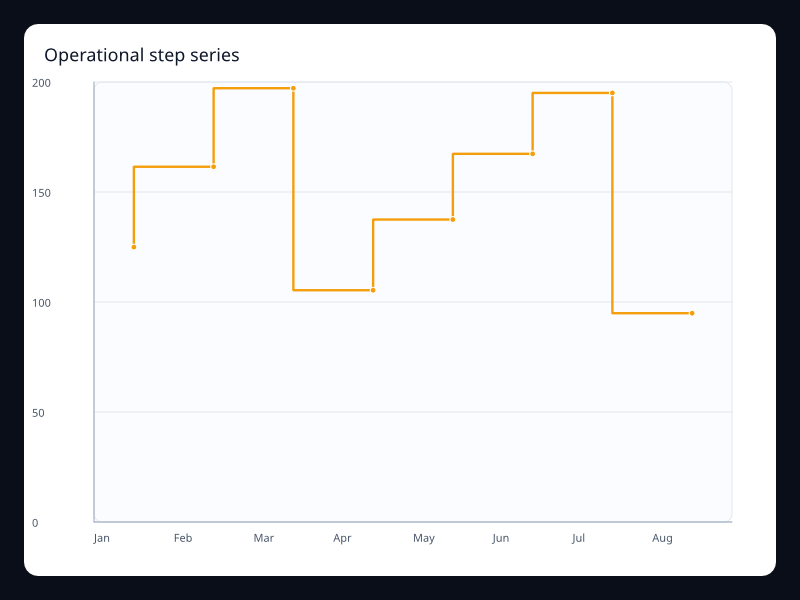
Operational step series uses Fission Charts typed Rust data to render a production-ready line view. Use it for state changes, quotas, or inventory counts.
Data: Typed chart data, axes, and series.
Use when: Use it for state changes, quotas, or inventory counts
Tags: line
Product mix area
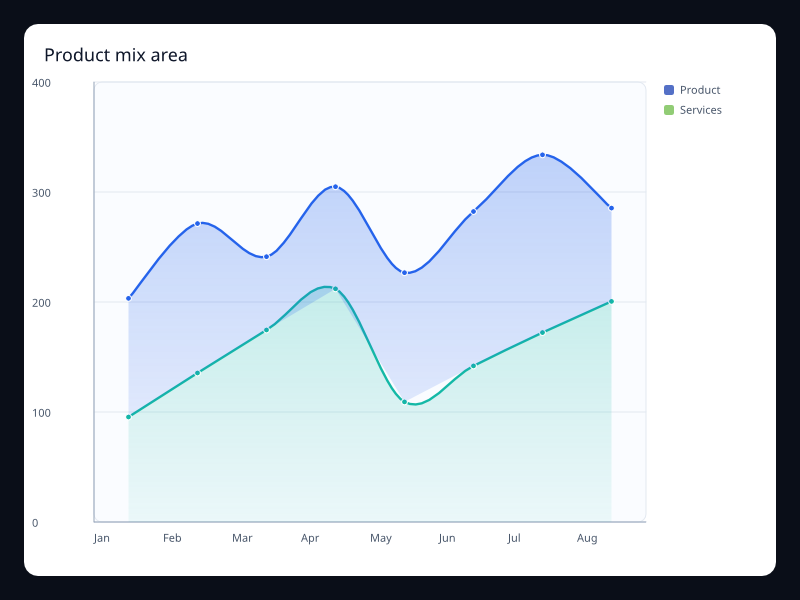
Product mix area uses Fission Charts typed Rust data to render a production-ready line view. Use it when the total and category mix both matter.
Data: Typed chart data, axes, and series.
Use when: Use it when the total and category mix both matter
Tags: area
Quality operating band
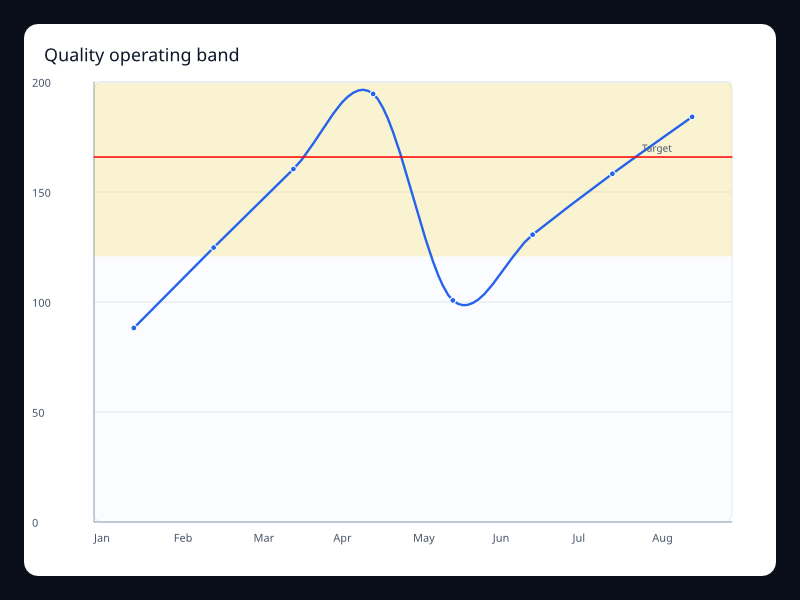
Quality operating band uses Fission Charts typed Rust data to render a production-ready line view. Use it for production quality metrics with explicit guardrails.
Data: Typed chart data, axes, and series.
Use when: Use it for production quality metrics with explicit guardrails
Tags: line
Regional trend comparison
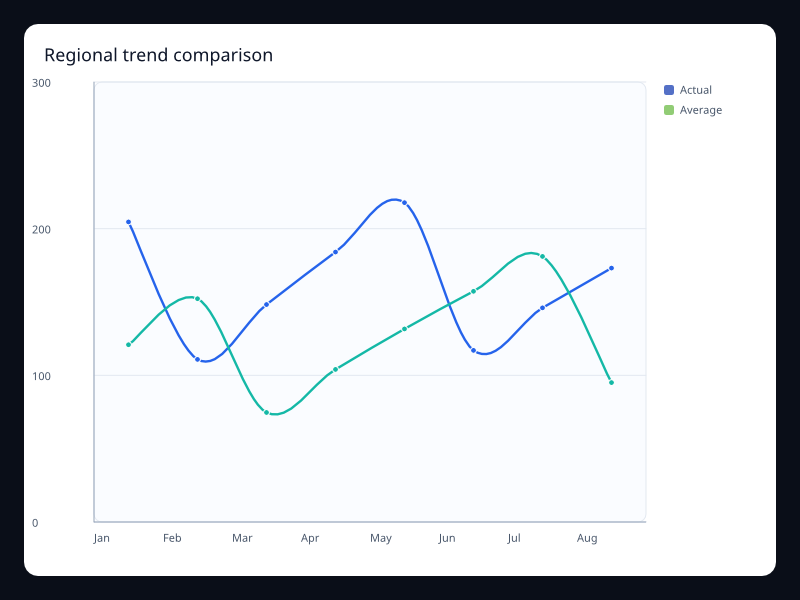
Regional trend comparison uses Fission Charts typed Rust data to render a production-ready line view. Use it when teams compare regions over the same period.
Data: Typed chart data, axes, and series.
Use when: Use it when teams compare regions over the same period
Tags: line
Release window annotation
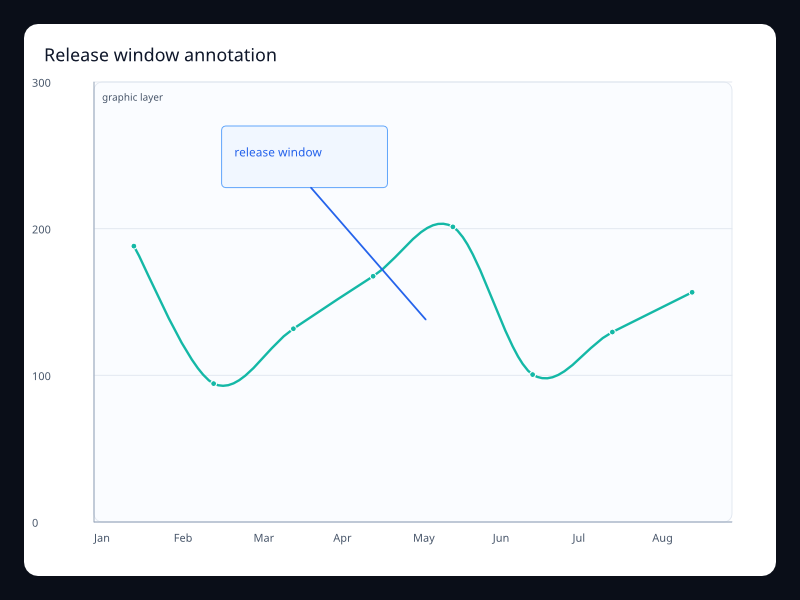
Release window annotation uses Fission Charts typed Rust data to render a production-ready line view. Use it when a chart needs to explain why a trend changed.
Data: Typed chart data, axes, and series.
Use when: Use it when a chart needs to explain why a trend changed
Tags: line
Retention zoom window
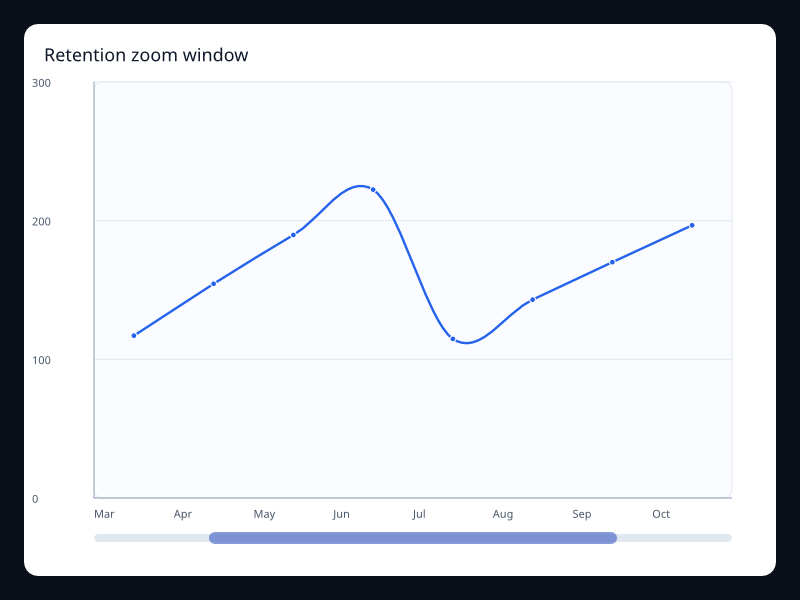
Retention zoom window uses Fission Charts typed Rust data to render a production-ready line view. Use it when the primary view should focus on one time range.
Data: Typed chart data, axes, and series.
Use when: Use it when the primary view should focus on one time range
Tags: line
Revenue seasonality
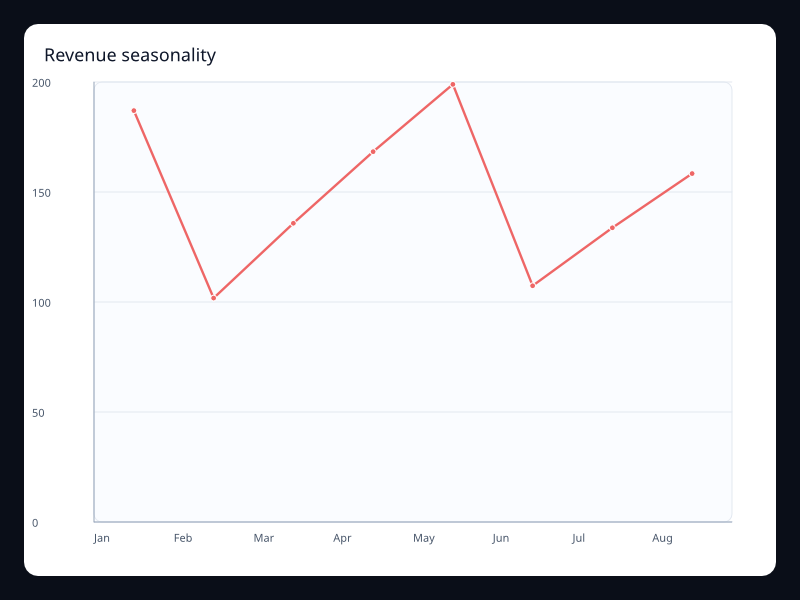
Revenue seasonality uses Fission Charts typed Rust data to render a production-ready line view. Use it when weekly or monthly rhythm is the main signal.
Data: Typed chart data, axes, and series.
Use when: Use it when weekly or monthly rhythm is the main signal
Tags: line
Rolling average line
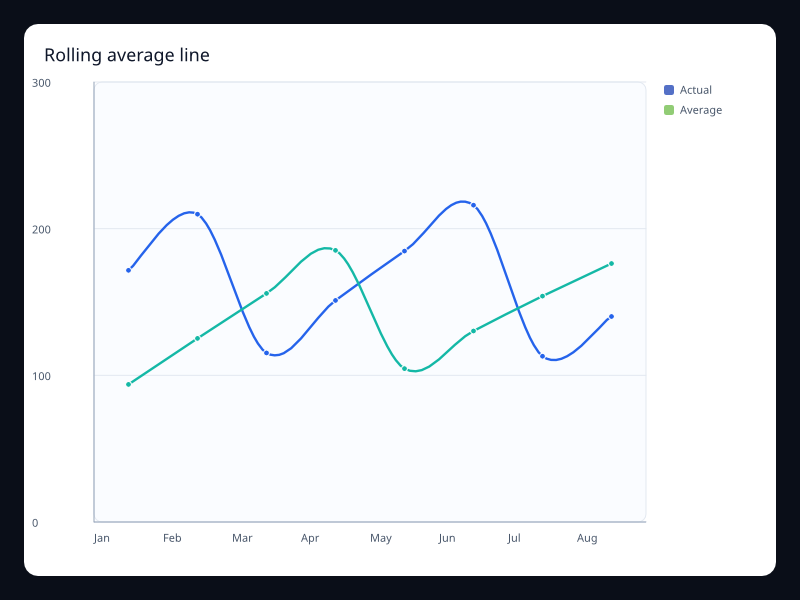
Raw metric and smoothed average on one chart. Use it when readers need both movement and trend.
Data: Typed chart data, axes, and series.
Use when: Use it when readers need both movement and trend
Tags: line
Seasonal line
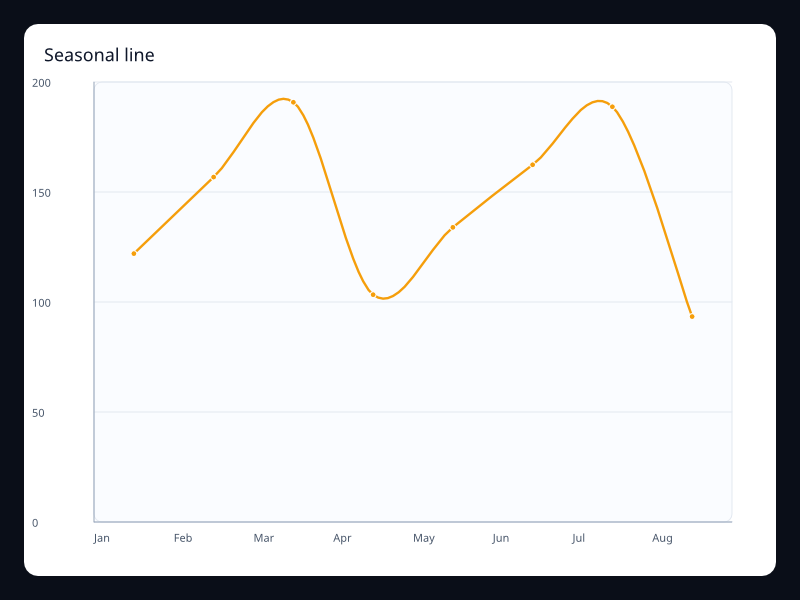
Trend samples shaped as a seasonal curve. Use it for seasonal demand and capacity planning.
Data: Typed chart data, axes, and series.
Use when: Use it for seasonal demand and capacity planning
Tags: line
Service latency trend
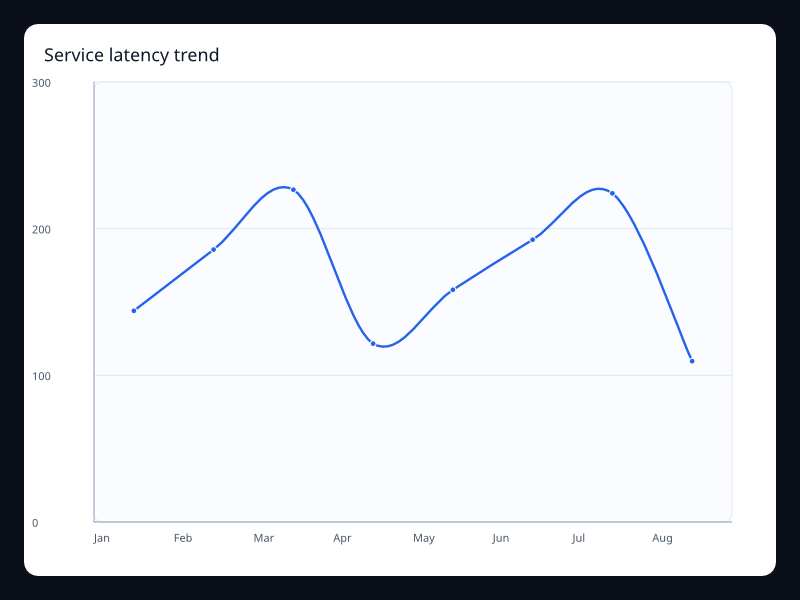
Service latency trend uses Fission Charts typed Rust data to render a production-ready line view. Use it for operations screens that need drift and spikes in one glance.
Data: Typed chart data, axes, and series.
Use when: Use it for operations screens that need drift and spikes in one glance
Tags: line
Signup cohort comparison
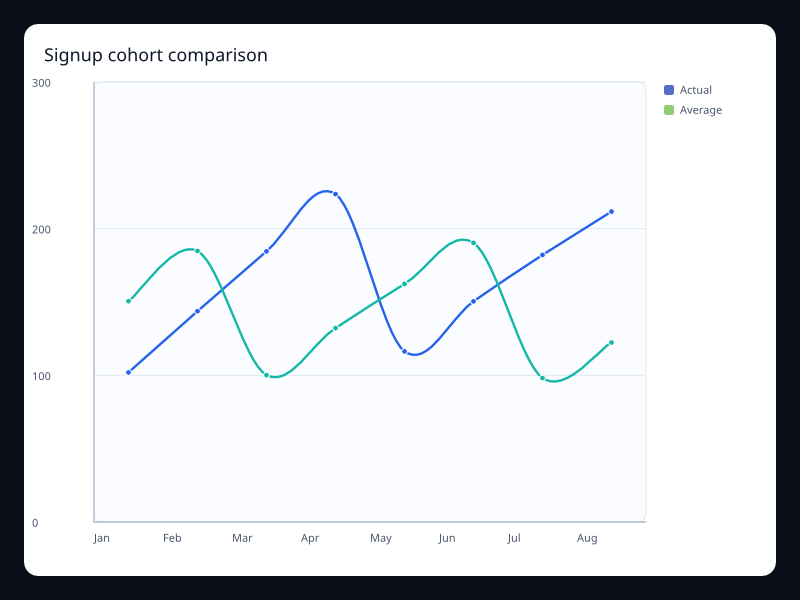
Signup cohort comparison uses Fission Charts typed Rust data to render a production-ready line view. Use it when users need to compare cohorts over the same time range.
Data: Typed chart data, axes, and series.
Use when: Use it when users need to compare cohorts over the same time range
Tags: line
Dense spark line
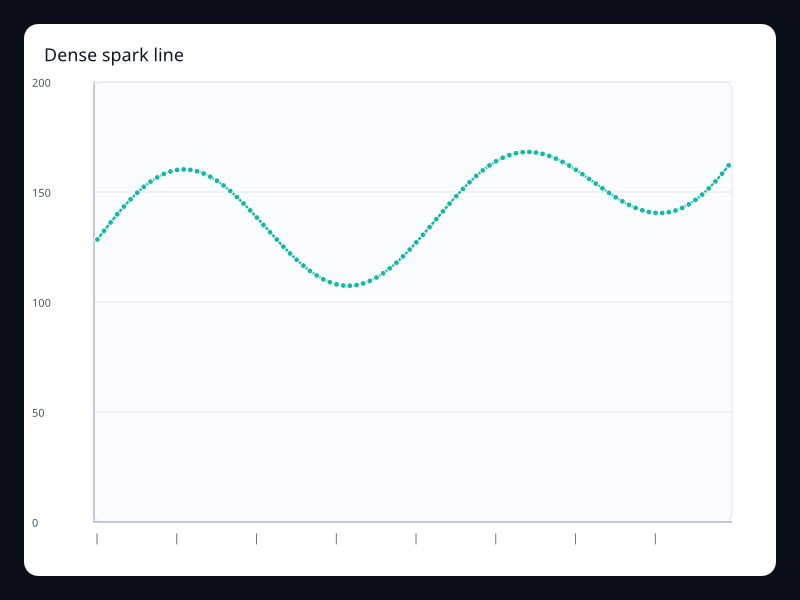
Compact dense line with many telemetry samples. Use it for monitoring and telemetry surfaces.
Data: Typed chart data, axes, and series.
Use when: Use it for monitoring and telemetry surfaces
Tags: line
Stacked stream area
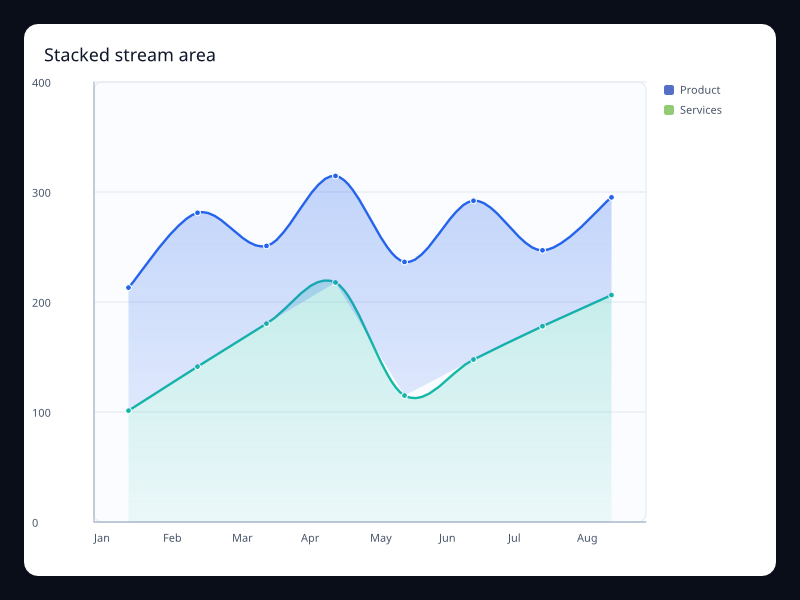
Stacked area series showing total and composition. Use it for composition over time.
Data: Typed chart data, axes, and series.
Use when: Use it for composition over time
Tags: line
Step end line
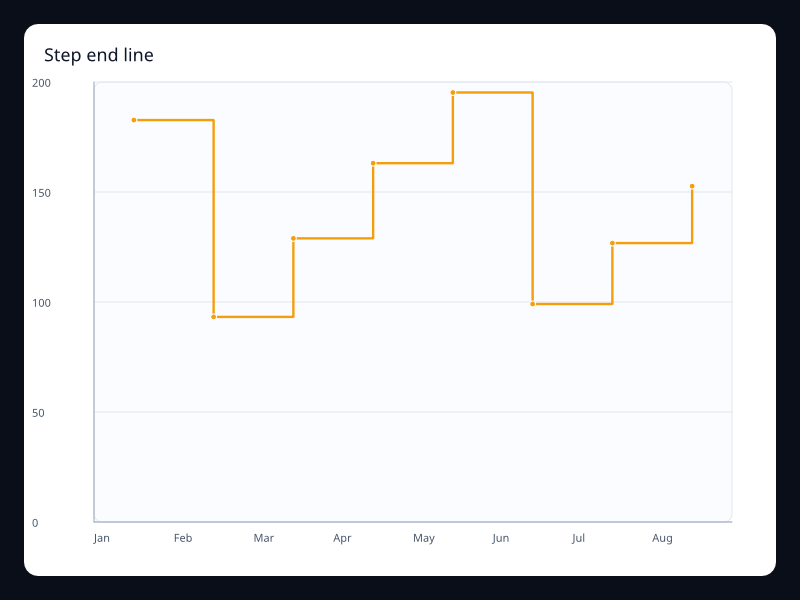
Discrete state changes drawn at interval ends. Use it when values settle at the end of each interval.
Data: Typed chart data, axes, and series.
Use when: Use it when values settle at the end of each interval
Tags: line
Step start line
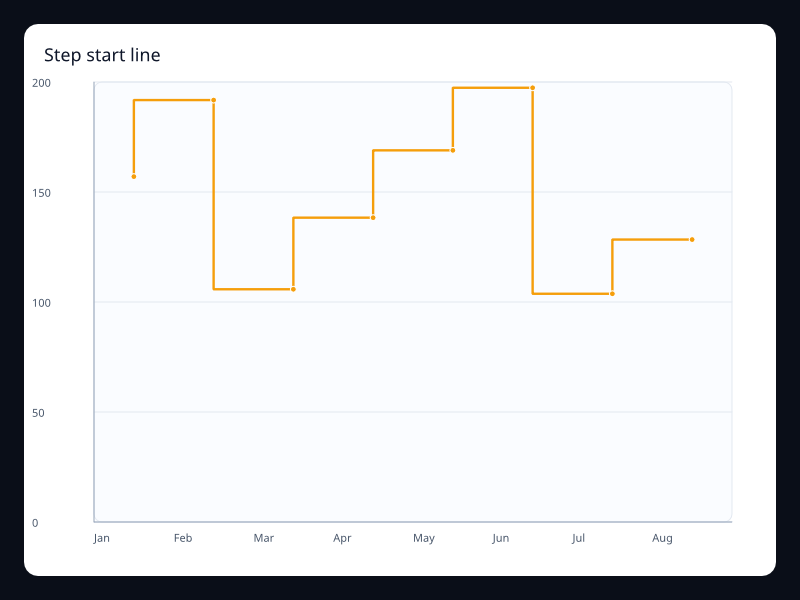
Discrete state changes drawn as step segments. Use it when values jump at the start of each interval.
Data: Typed chart data, axes, and series.
Use when: Use it when values jump at the start of each interval
Tags: line
Support volume area
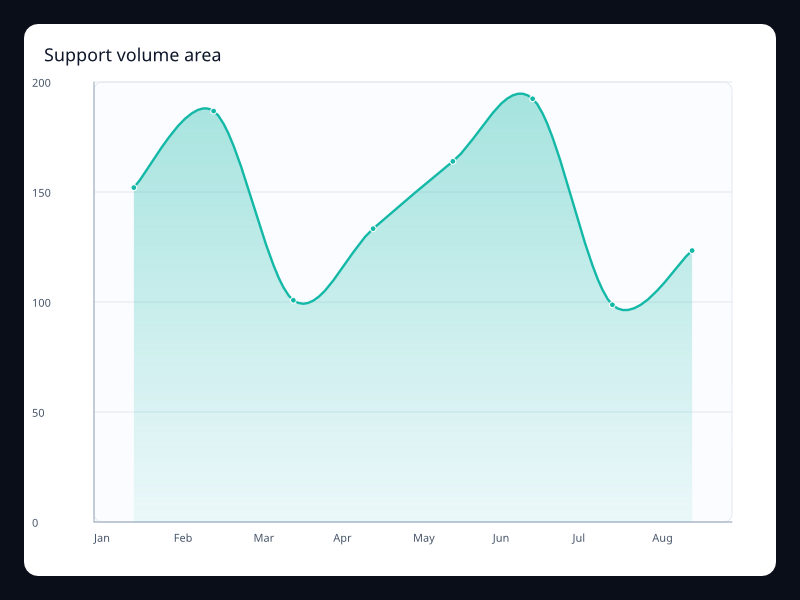
Support volume area uses Fission Charts typed Rust data to render a production-ready line view. Use it when volume should be visible at a glance.
Data: Typed chart data, axes, and series.
Use when: Use it when volume should be visible at a glance
Tags: area
Line with threshold
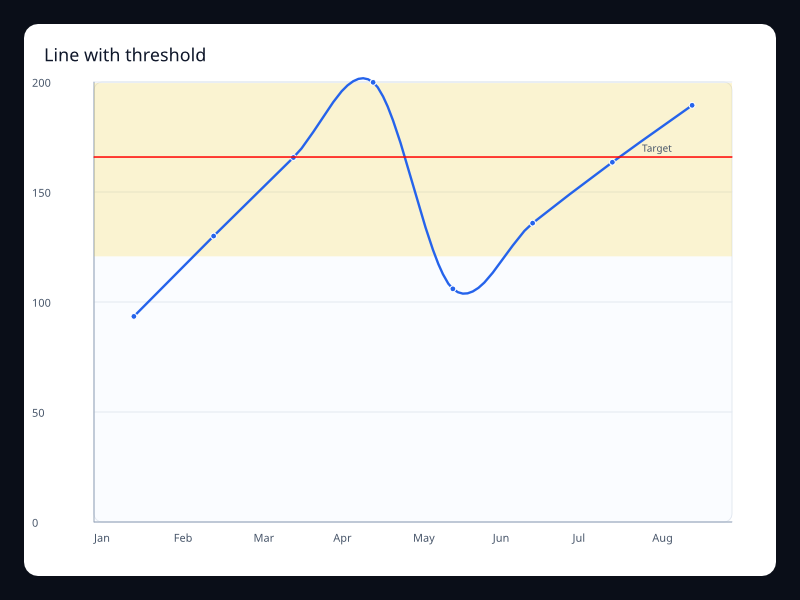
Line chart with a target line and highlighted operating band. Use it for service levels, quotas, and alert thresholds.
Data: Typed chart data, axes, and series.
Use when: Use it for service levels, quotas, and alert thresholds
Tags: line
Traffic rolling average
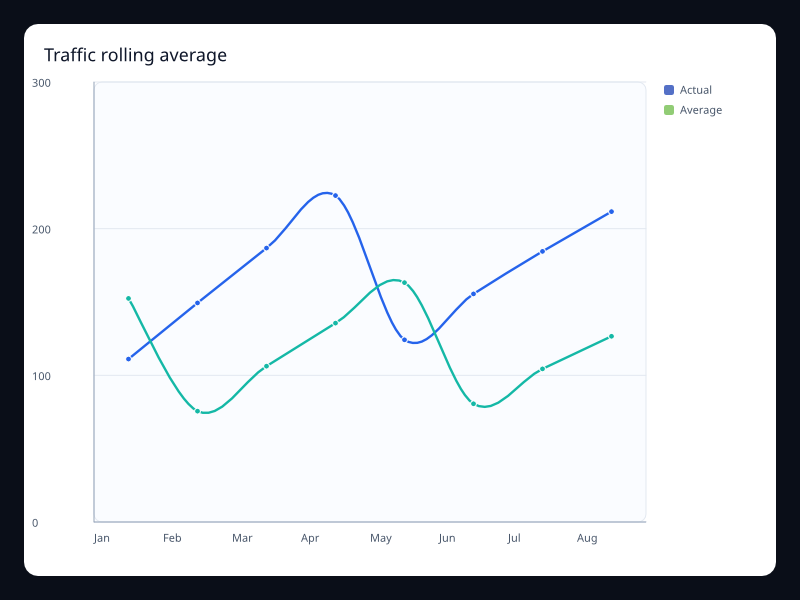
Traffic rolling average uses Fission Charts typed Rust data to render a production-ready line view. Use it when the user needs the current signal and the trend baseline.
Data: Typed chart data, axes, and series.
Use when: Use it when the user needs the current signal and the trend baseline
Tags: line
Weekly cycle line
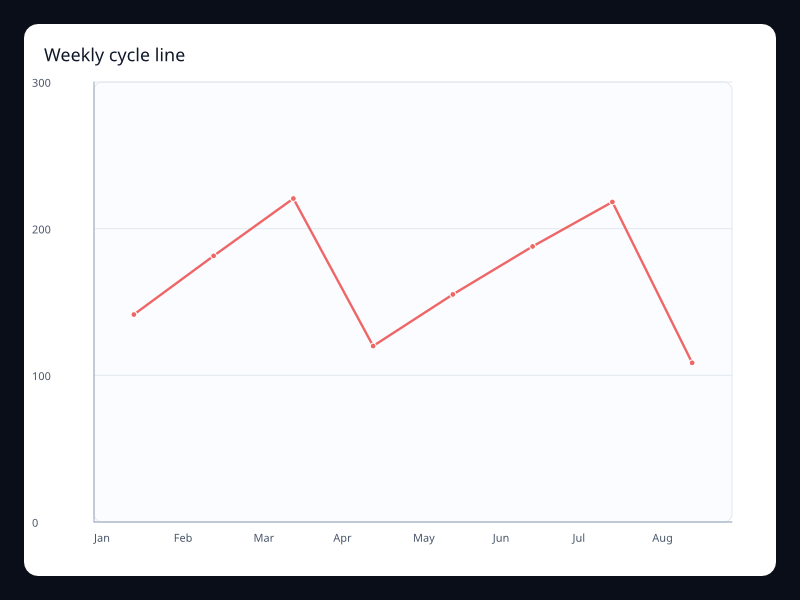
Ordered samples over a repeating weekly cycle. Use it for operational rhythms and weekly dashboards.
Data: Typed chart data, axes, and series.
Use when: Use it for operational rhythms and weekly dashboards
Tags: line
Zoomed line window
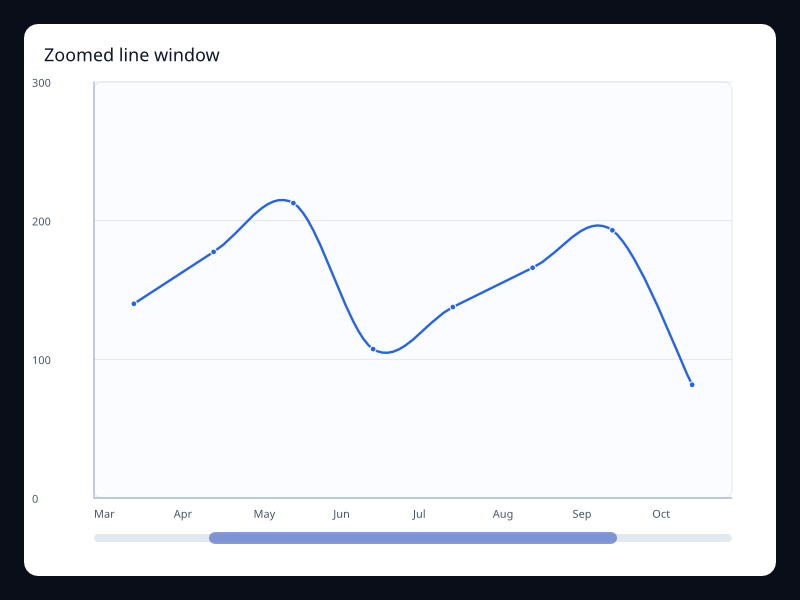
Ordered line data filtered through a data zoom window. Use it for long series with local inspection.
Data: Typed chart data, axes, and series.
Use when: Use it for long series with local inspection
Tags: line
Monitoring
Monitoring 3D cloud
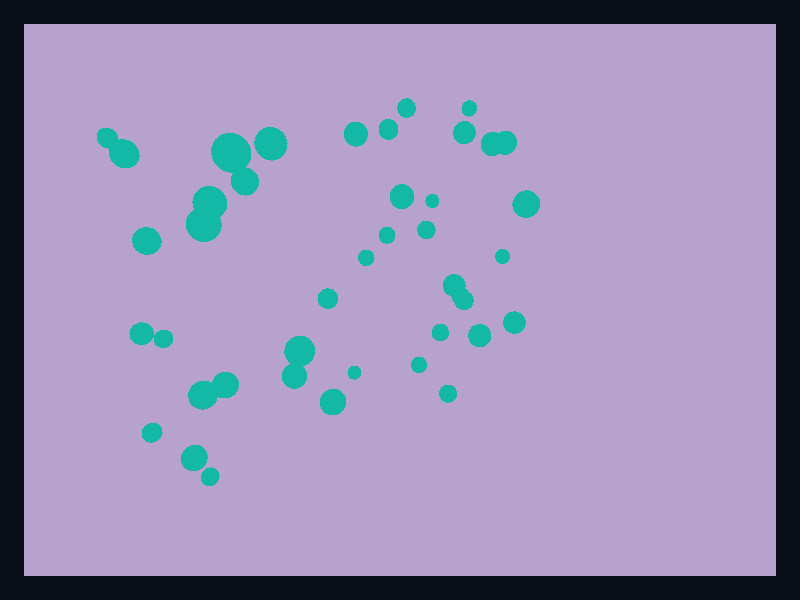
Monitoring 3D cloud uses Fission Charts typed Rust data to render a production-ready monitoring view. Use it for dense spatial monitoring views.
Data: Typed chart data, axes, and series.
Use when: Use it for dense spatial monitoring views
Tags: monitoring
Monitoring 3D grid

Monitoring 3D grid uses Fission Charts typed Rust data to render a production-ready monitoring view. Use it for spatial operational demonstrations.
Data: Typed chart data, axes, and series.
Use when: Use it for spatial operational demonstrations
Tags: monitoring
Monitoring annotation
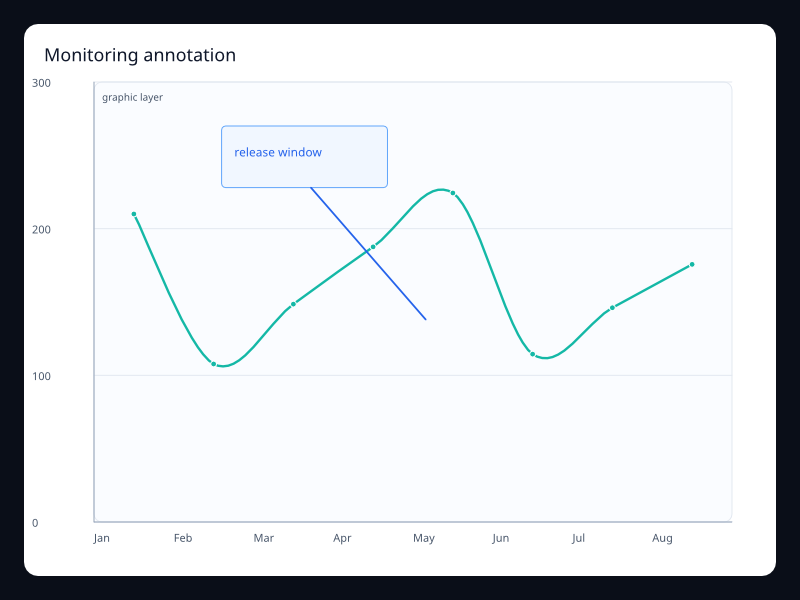
Monitoring annotation uses Fission Charts typed Rust data to render a production-ready monitoring view. Use it when dashboards need explanatory context.
Data: Typed chart data, axes, and series.
Use when: Use it when dashboards need explanatory context
Tags: monitoring
Brush investigation
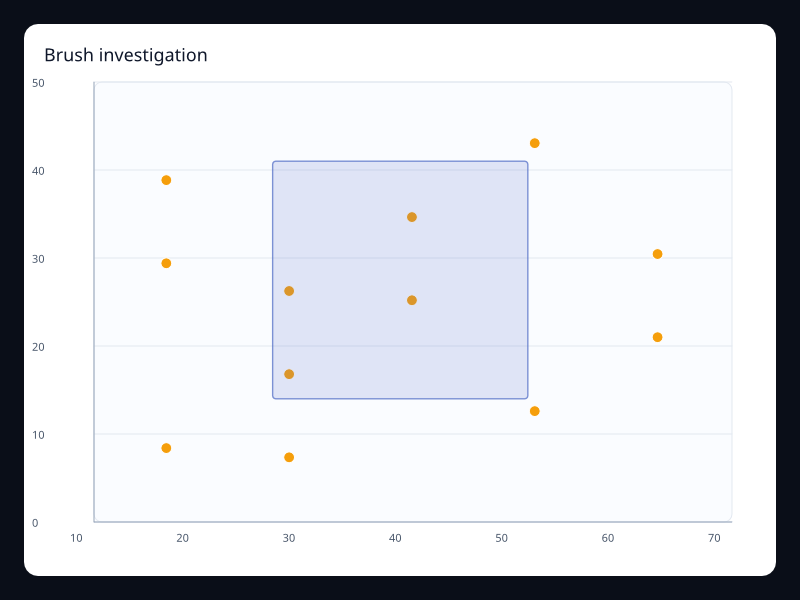
Brush investigation uses Fission Charts typed Rust data to render a production-ready monitoring view. Use it when incidents require selecting a point range.
Data: Typed chart data, axes, and series.
Use when: Use it when incidents require selecting a point range
Tags: monitoring
Capacity gauge
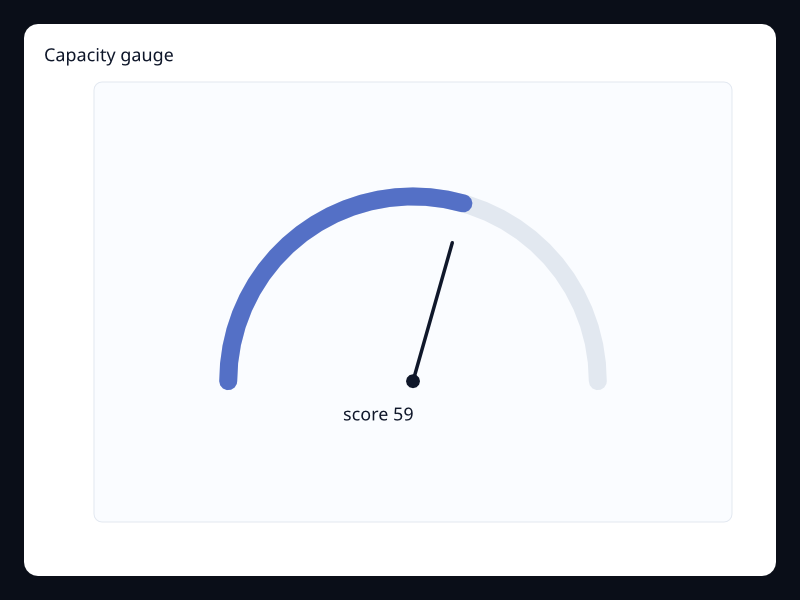
Capacity gauge uses Fission Charts typed Rust data to render a production-ready monitoring view. Use it for critical status cards.
Data: Typed chart data, axes, and series.
Use when: Use it for critical status cards
Tags: monitoring
Dependency graph
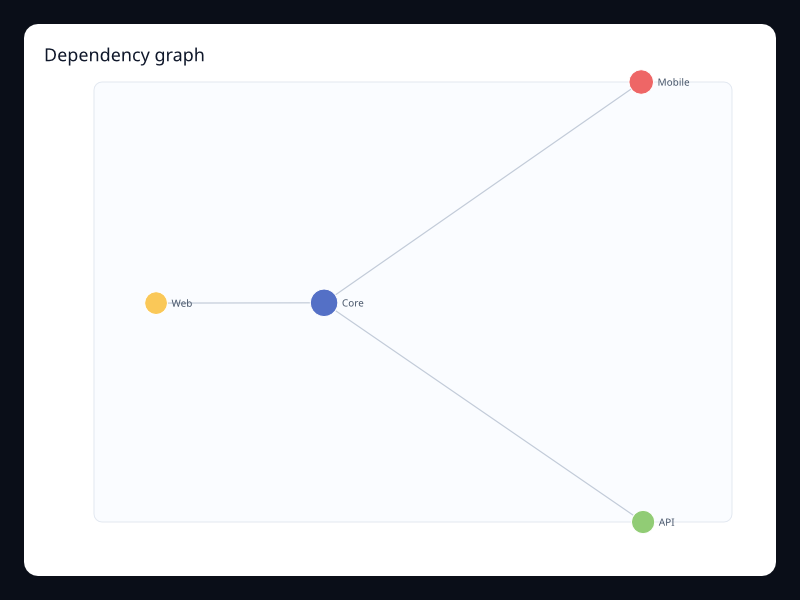
Dependency graph uses Fission Charts typed Rust data to render a production-ready monitoring view. Use it for operational topology.
Data: Typed chart data, axes, and series.
Use when: Use it for operational topology
Tags: monitoring
Monitoring error band
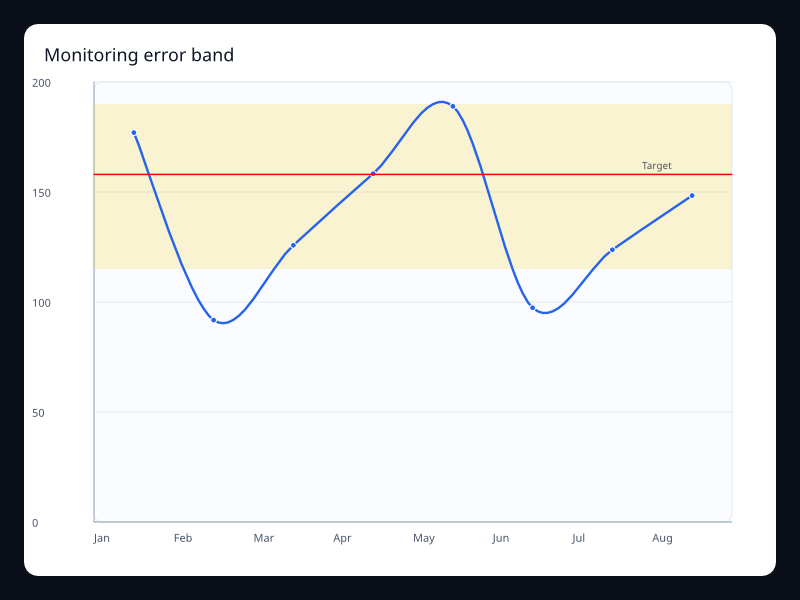
Monitoring error band uses Fission Charts typed Rust data to render a production-ready monitoring view. Use it when alert ranges must be visible.
Data: Typed chart data, axes, and series.
Use when: Use it when alert ranges must be visible
Tags: monitoring
Error scatter
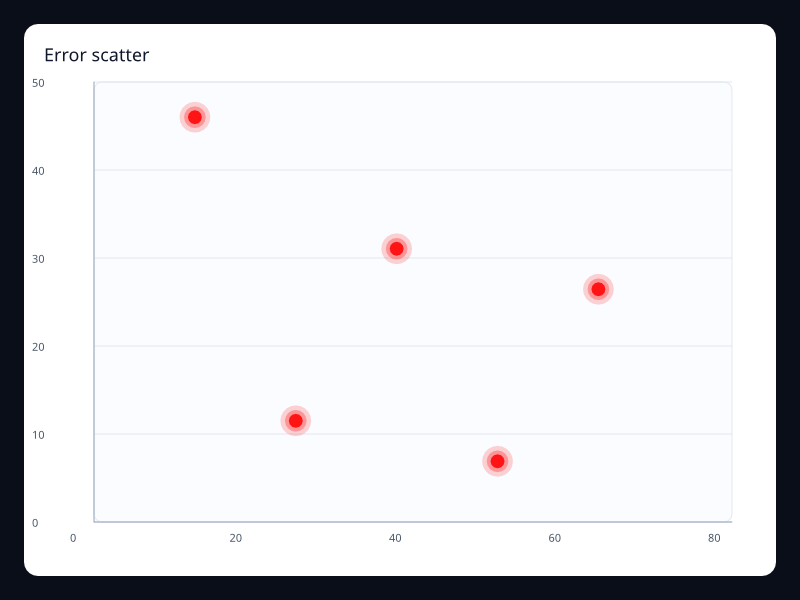
Error scatter uses Fission Charts typed Rust data to render a production-ready monitoring view. Use it for outlier-heavy operational views.
Data: Typed chart data, axes, and series.
Use when: Use it for outlier-heavy operational views
Tags: monitoring
Operational flow sankey
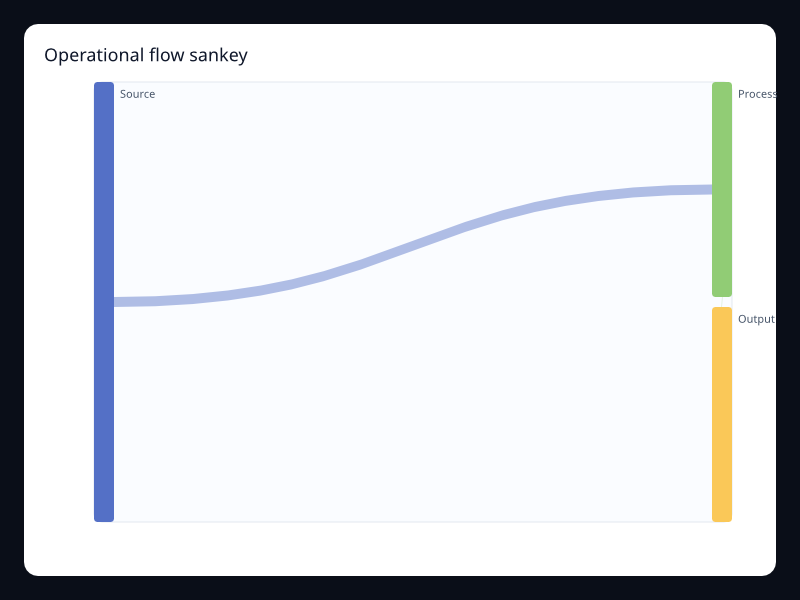
Operational flow sankey uses Fission Charts typed Rust data to render a production-ready monitoring view. Use it for request and process flow.
Data: Typed chart data, axes, and series.
Use when: Use it for request and process flow
Tags: monitoring
Load heatmap
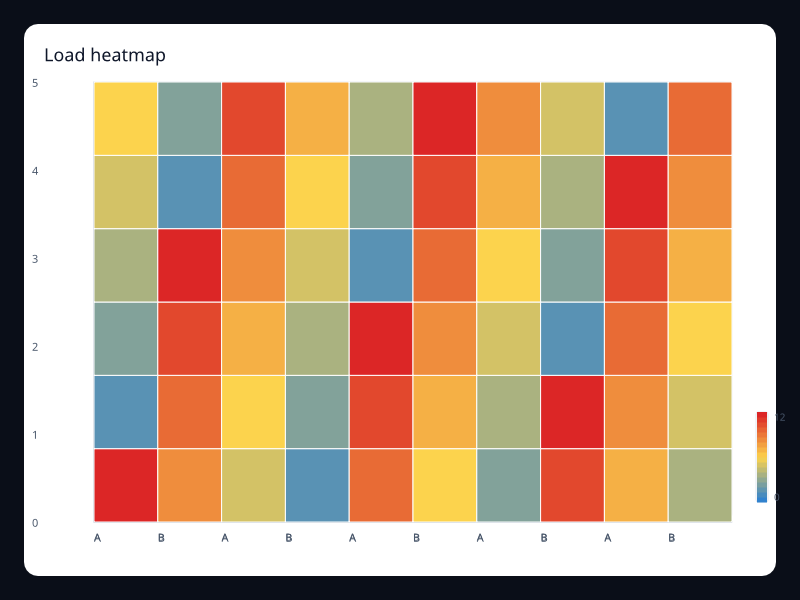
Load heatmap uses Fission Charts typed Rust data to render a production-ready monitoring view. Use it for time and resource concentration.
Data: Typed chart data, axes, and series.
Use when: Use it for time and resource concentration
Tags: monitoring
Monitoring overview line
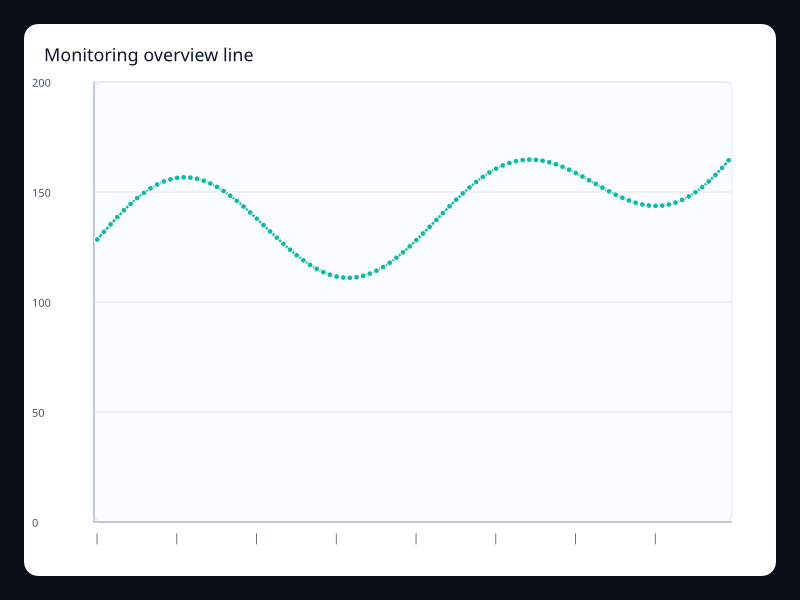
Monitoring overview line uses Fission Charts typed Rust data to render a production-ready monitoring view. Use it for top-level operational dashboards.
Data: Typed chart data, axes, and series.
Use when: Use it for top-level operational dashboards
Tags: monitoring
Operational region map
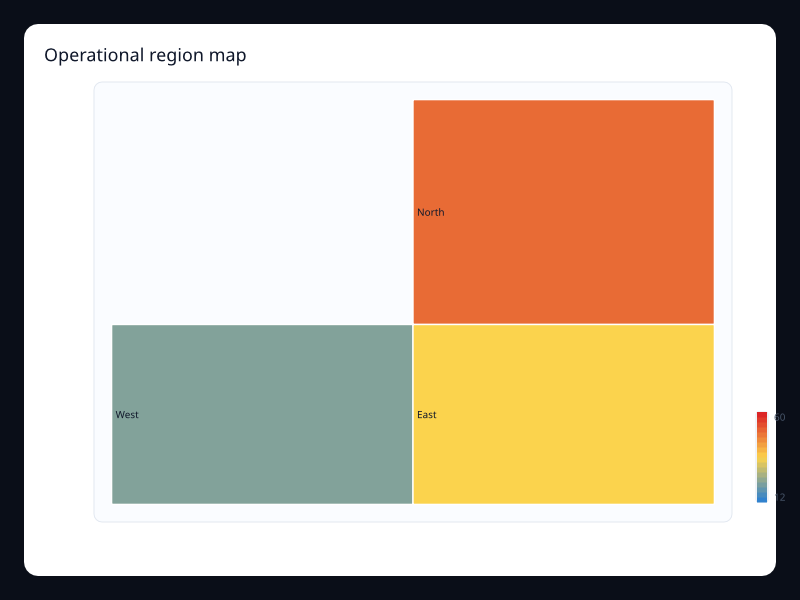
Operational region map uses Fission Charts typed Rust data to render a production-ready monitoring view. Use it for geographic operations.
Data: Typed chart data, axes, and series.
Use when: Use it for geographic operations
Tags: monitoring
Release timeline
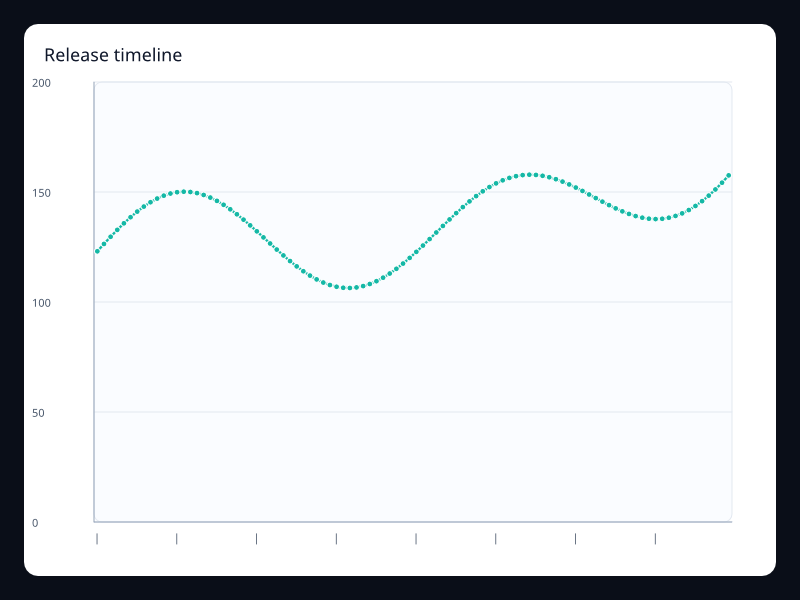
Release timeline uses Fission Charts typed Rust data to render a production-ready monitoring view. Use it for release-based dashboards.
Data: Typed chart data, axes, and series.
Use when: Use it for release-based dashboards
Tags: monitoring
Monitoring risk radar
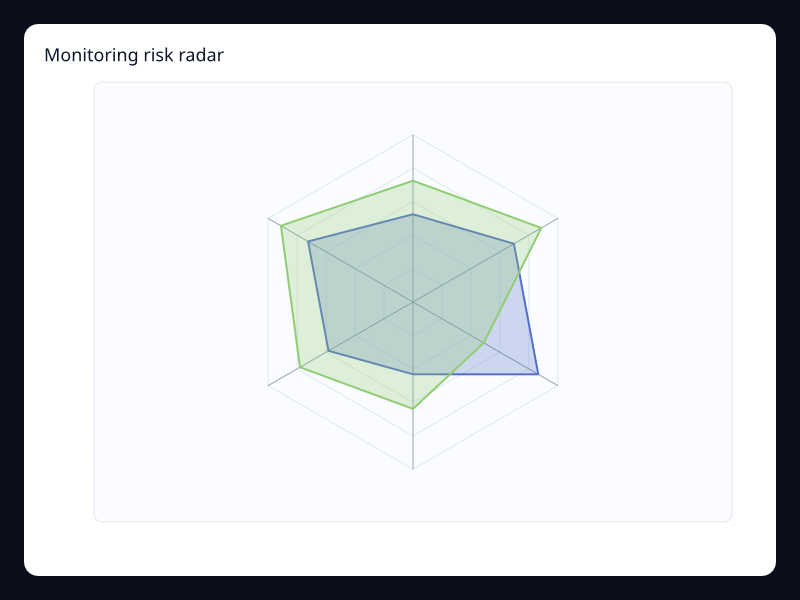
Monitoring risk radar uses Fission Charts typed Rust data to render a production-ready monitoring view. Use it for status summaries across dimensions.
Data: Typed chart data, axes, and series.
Use when: Use it for status summaries across dimensions
Tags: monitoring
Operational route lines
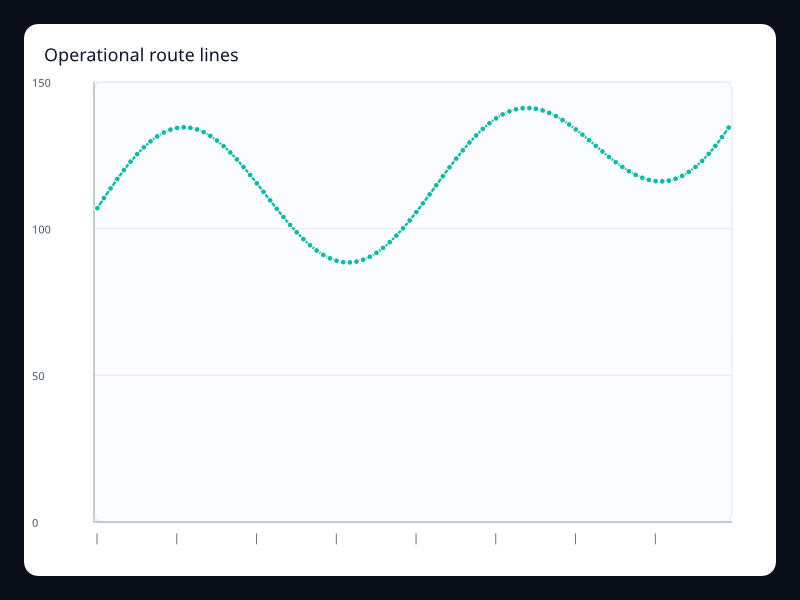
Operational route lines uses Fission Charts typed Rust data to render a production-ready monitoring view. Use it for route and link movement.
Data: Typed chart data, axes, and series.
Use when: Use it for route and link movement
Tags: monitoring
Service rank
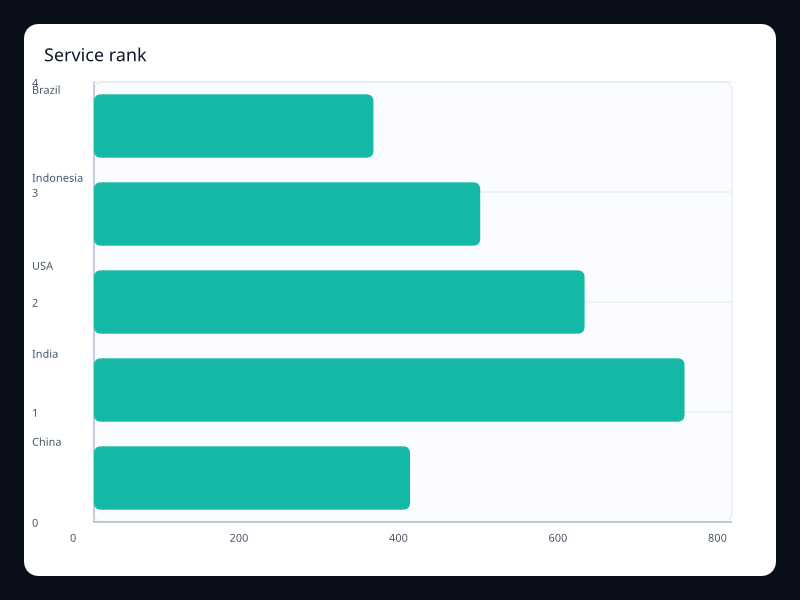
Service rank uses Fission Charts typed Rust data to render a production-ready monitoring view. Use it to focus on the largest contributors.
Data: Typed chart data, axes, and series.
Use when: Use it to focus on the largest contributors
Tags: monitoring
Monitoring event strip
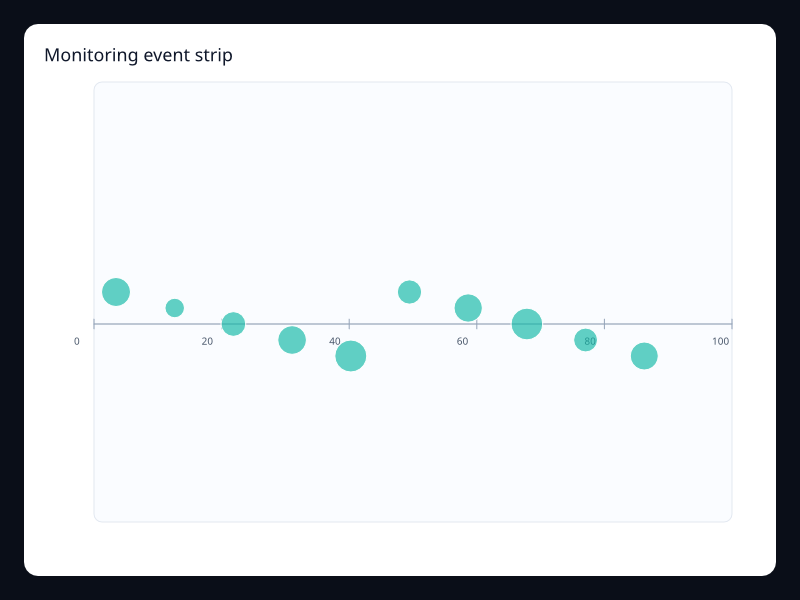
Monitoring event strip uses Fission Charts typed Rust data to render a production-ready monitoring view. Use it for compact event timeline rows.
Data: Typed chart data, axes, and series.
Use when: Use it for compact event timeline rows
Tags: monitoring
Monitoring toolbox
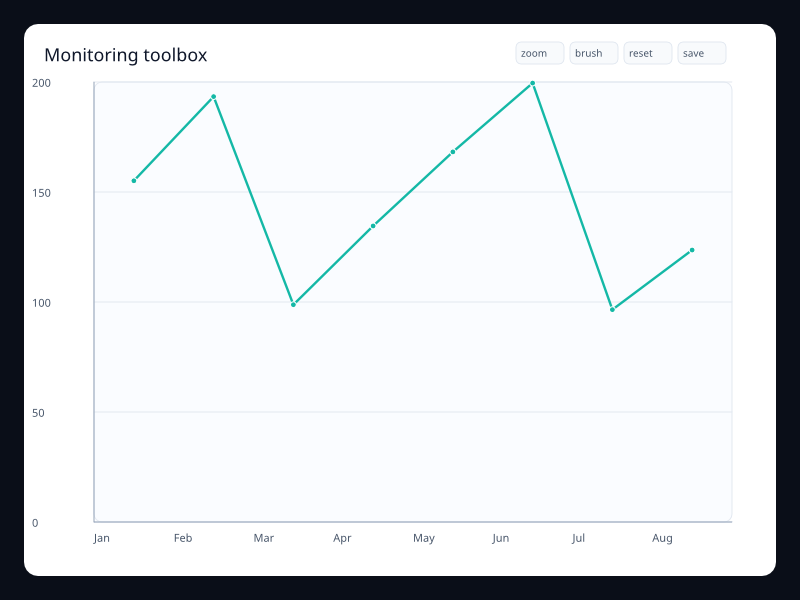
Monitoring toolbox uses Fission Charts typed Rust data to render a production-ready monitoring view. Use it when charts need local analysis controls.
Data: Typed chart data, axes, and series.
Use when: Use it when charts need local analysis controls
Tags: monitoring
Monitoring traffic bars
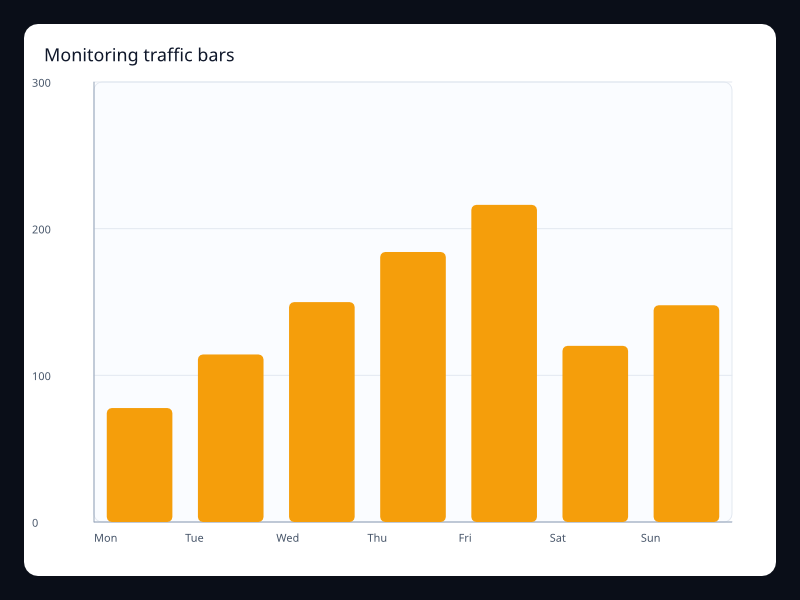
Monitoring traffic bars uses Fission Charts typed Rust data to render a production-ready monitoring view. Use it for quick categorical traffic summaries.
Data: Typed chart data, axes, and series.
Use when: Use it for quick categorical traffic summaries
Tags: monitoring
Uptime calendar
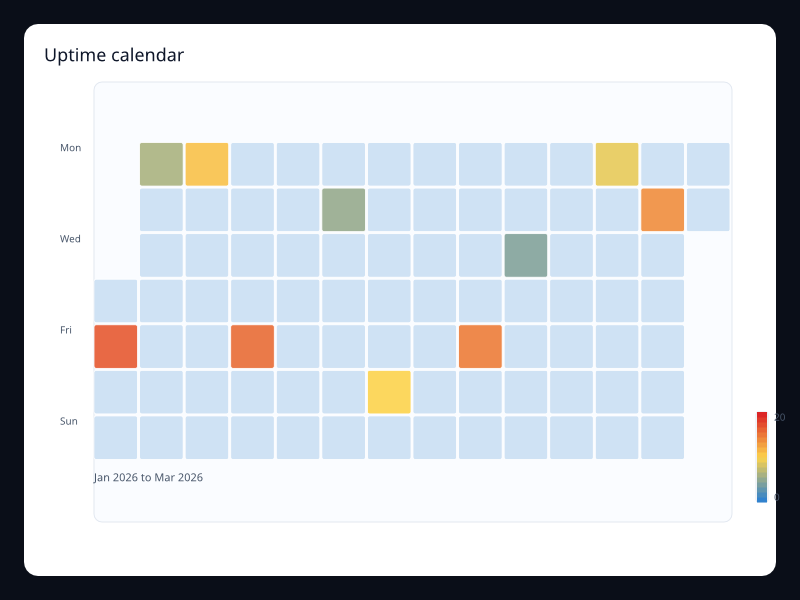
Uptime calendar uses Fission Charts typed Rust data to render a production-ready monitoring view. Use it for long-term reliability summaries.
Data: Typed chart data, axes, and series.
Use when: Use it for long-term reliability summaries
Tags: monitoring
Pie And Radial
Capacity gauge
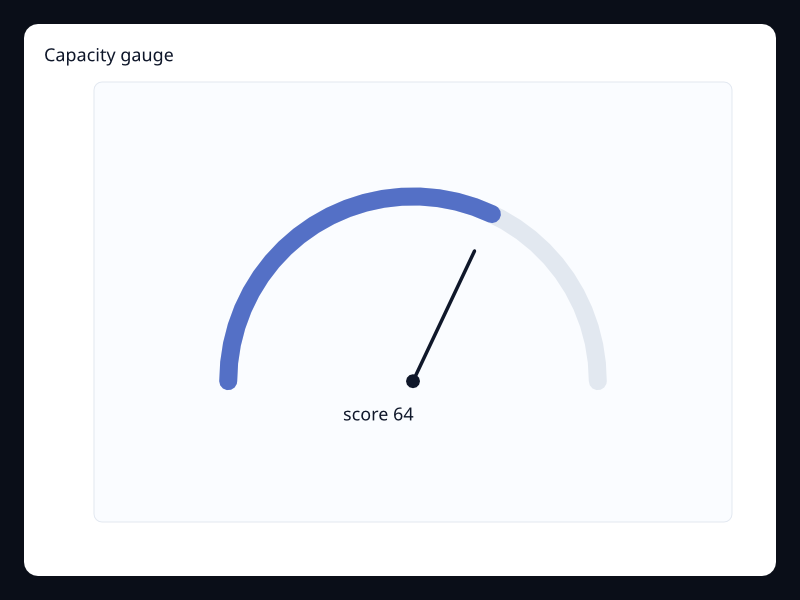
Gauge showing capacity consumed. Use it for operational capacity panels.
Data: Typed chart data, axes, and series.
Use when: Use it for operational capacity panels
Tags: gauge
Score gauge
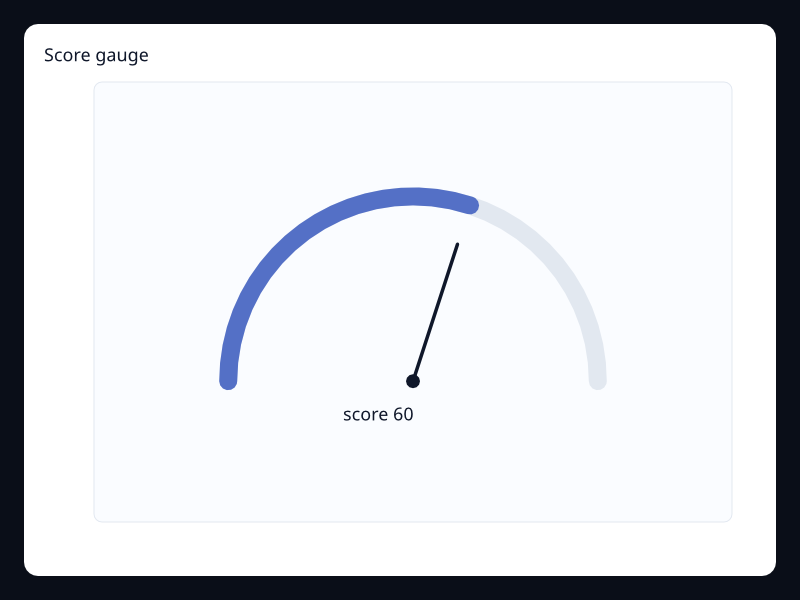
Bounded score shown as an instrument state. Use it for health or readiness scores.
Data: Typed chart data, axes, and series.
Use when: Use it for health or readiness scores
Tags: gauge
Area rose
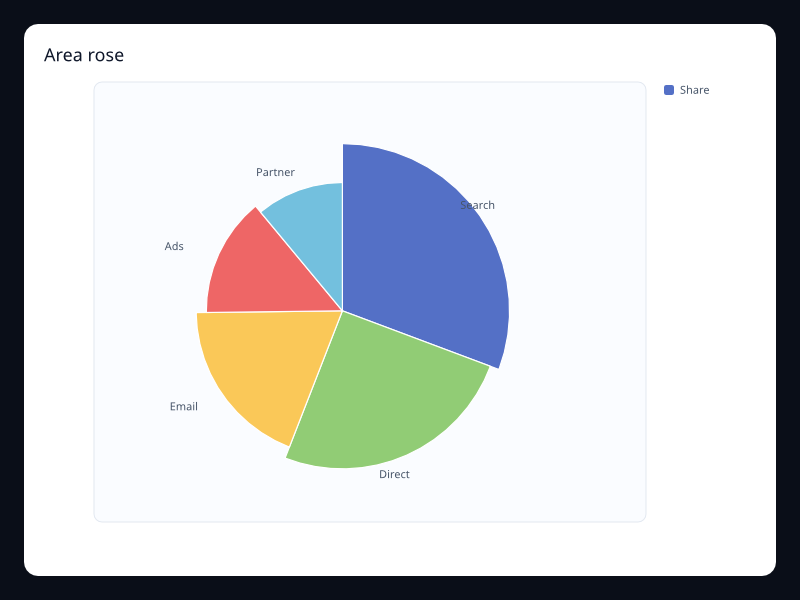
Rose chart using area-oriented radius scaling. Use it when small values should remain visible.
Data: Typed chart data, axes, and series.
Use when: Use it when small values should remain visible
Tags: pie
Device mix donut
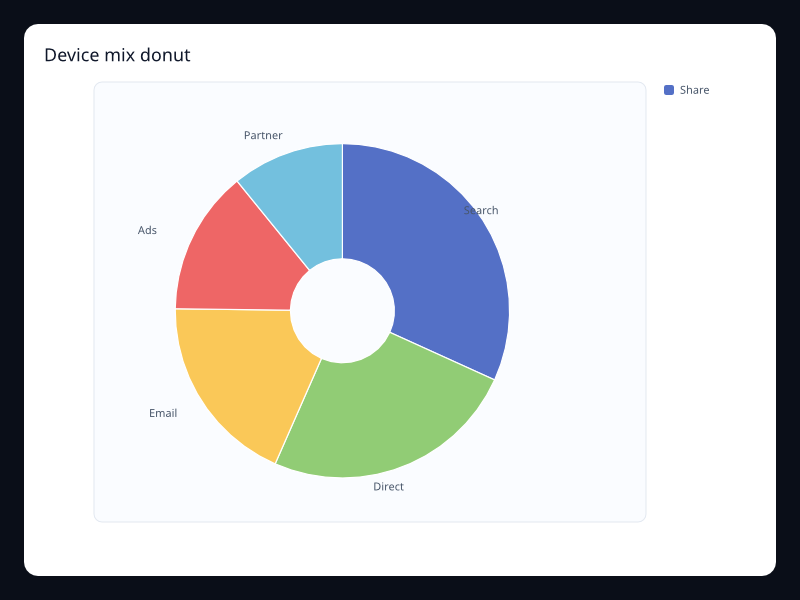
Donut chart for device or channel mix. Use it when the total belongs in the center of the chart.
Data: Typed chart data, axes, and series.
Use when: Use it when the total belongs in the center of the chart
Tags: pie
Market share pie
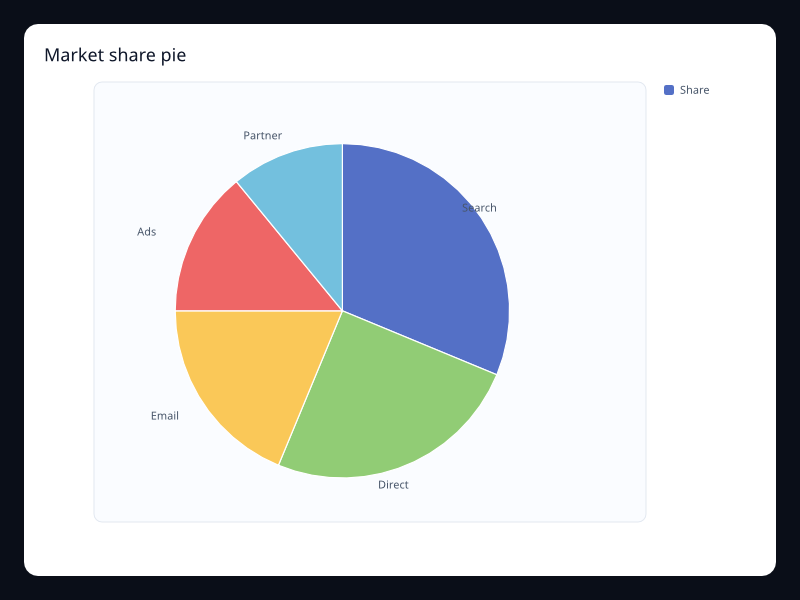
Part-to-whole chart for a small market mix. Use it for small composition snapshots.
Data: Typed chart data, axes, and series.
Use when: Use it for small composition snapshots
Tags: pie
Nested-style donut
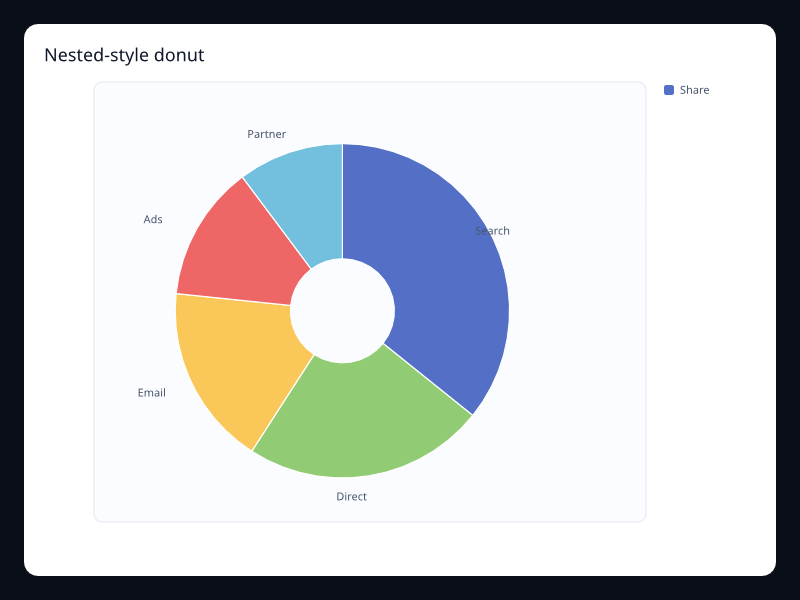
Donut-style chart with more categories and central whitespace. Use it when a central status label will be added by surrounding UI.
Data: Typed chart data, axes, and series.
Use when: Use it when a central status label will be added by surrounding UI
Tags: pie
Presentation rose
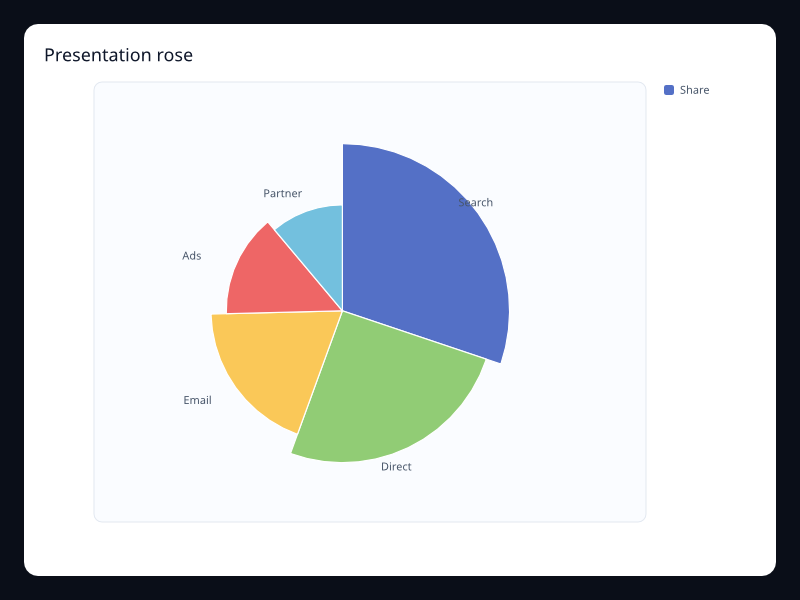
Rose chart emphasizing category differences with radius. Use it for presentation views with few categories.
Data: Typed chart data, axes, and series.
Use when: Use it for presentation views with few categories
Tags: pie
Two-level donut
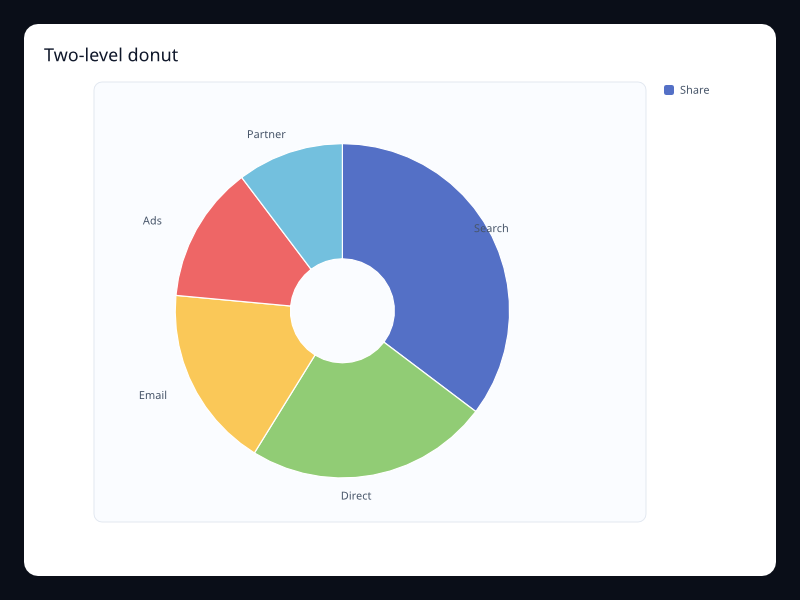
Donut chart for a small part-to-whole breakdown. Use it for compact composition summaries.
Data: Typed chart data, axes, and series.
Use when: Use it for compact composition summaries
Tags: pie
Cyclic polar bars
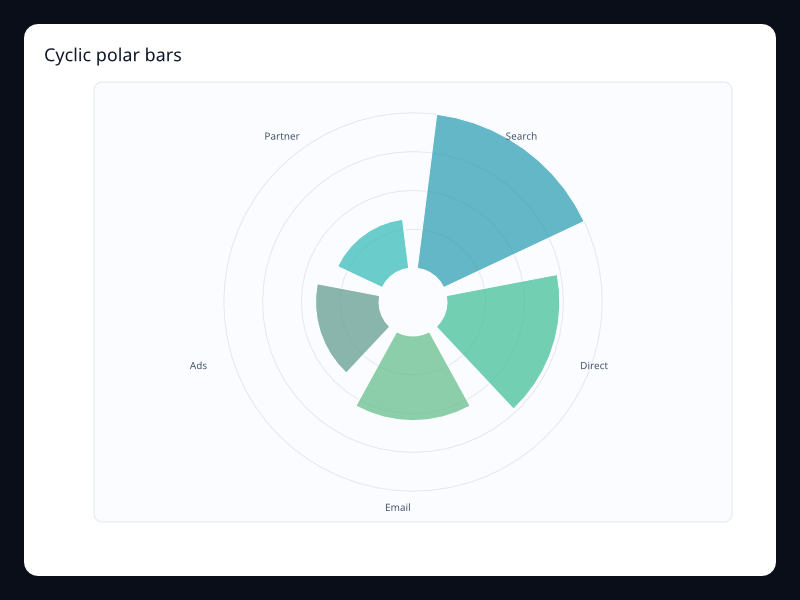
Radial bars around a cycle. Use it for cyclical categories.
Data: Typed chart data, axes, and series.
Use when: Use it for cyclical categories
Tags: polar
Wind polar line
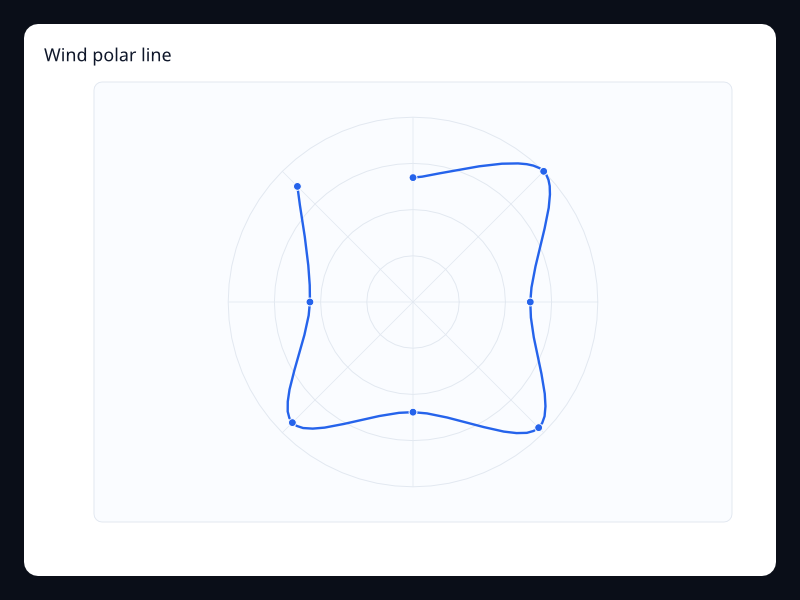
Directional values on a polar line. Use it for direction and magnitude data.
Data: Typed chart data, axes, and series.
Use when: Use it for direction and magnitude data
Tags: polar
Radar profile A
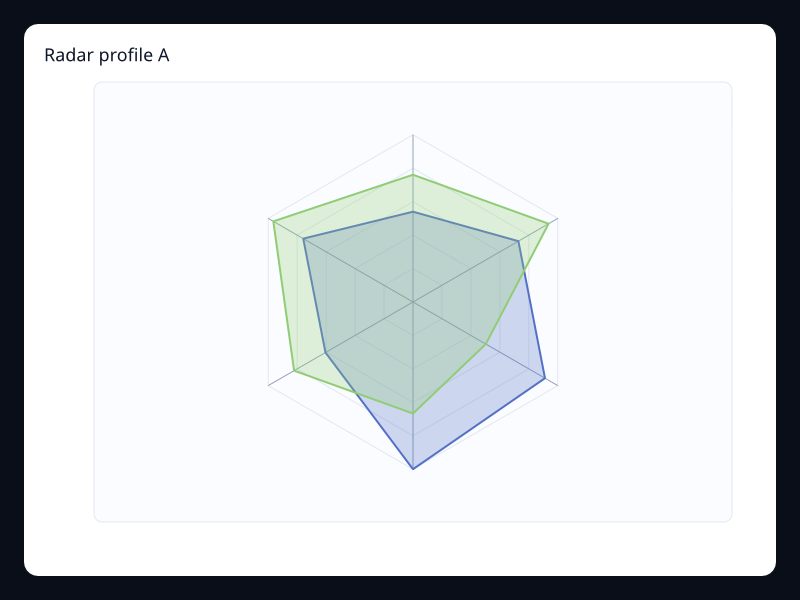
Profile comparison across fixed dimensions. Use it for capability or budget profiles.
Data: Typed chart data, axes, and series.
Use when: Use it for capability or budget profiles
Tags: radar
Radar profile B
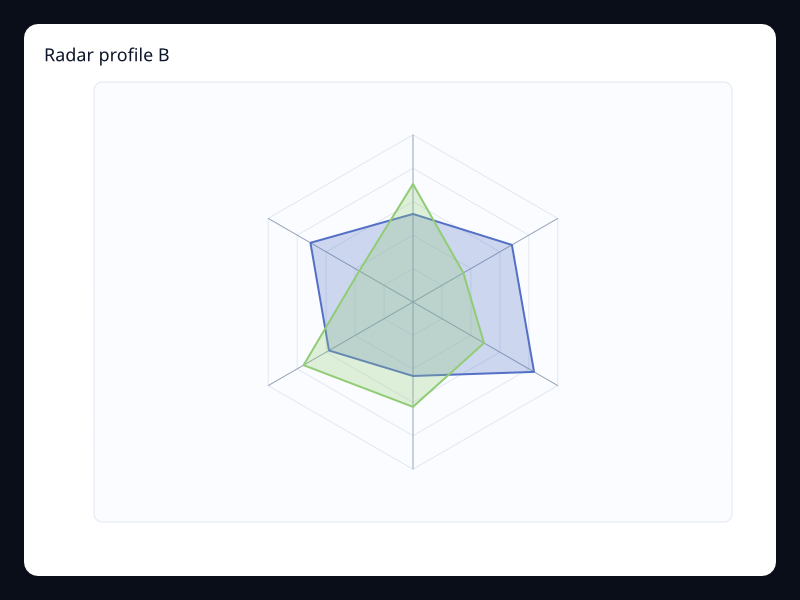
Filled radar chart for overlapping profile comparison. Use it when the profile shape matters.
Data: Typed chart data, axes, and series.
Use when: Use it when the profile shape matters
Tags: radar
Radial
Availability gauge
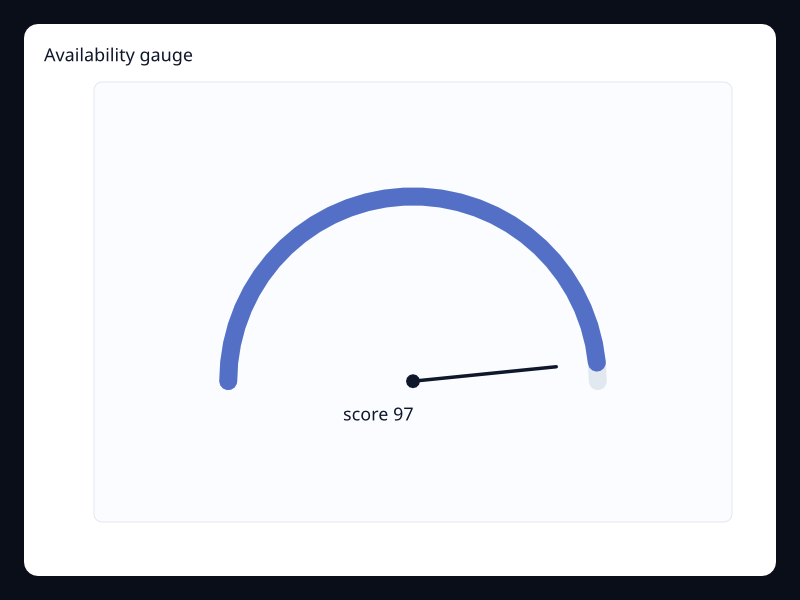
Availability gauge uses Fission Charts typed Rust data to render a production-ready radial view. Use it when a single current status dominates the screen.
Data: Typed chart data, axes, and series.
Use when: Use it when a single current status dominates the screen
Tags: gauge
Build confidence gauge
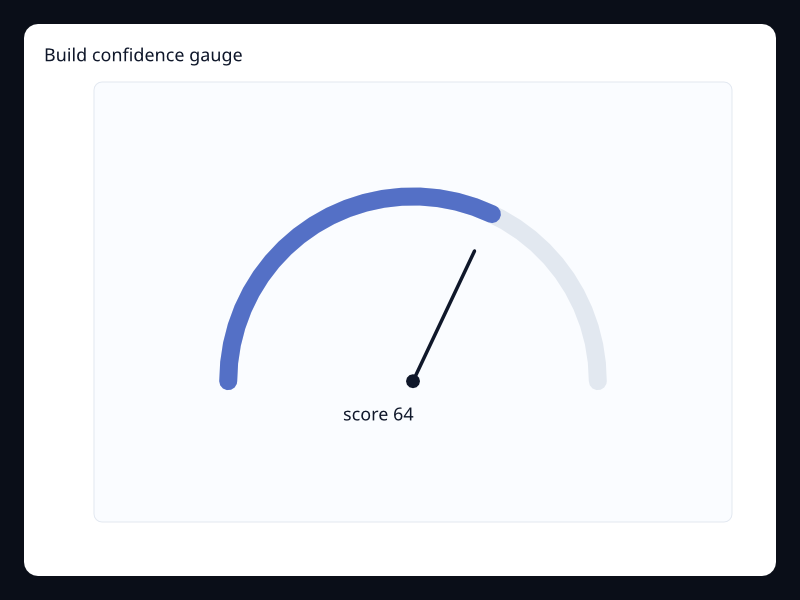
Build confidence gauge uses Fission Charts typed Rust data to render a production-ready radial view. Use it when a status panel needs a primary quality number.
Data: Typed chart data, axes, and series.
Use when: Use it when a status panel needs a primary quality number
Tags: gauge
Capacity headroom gauge
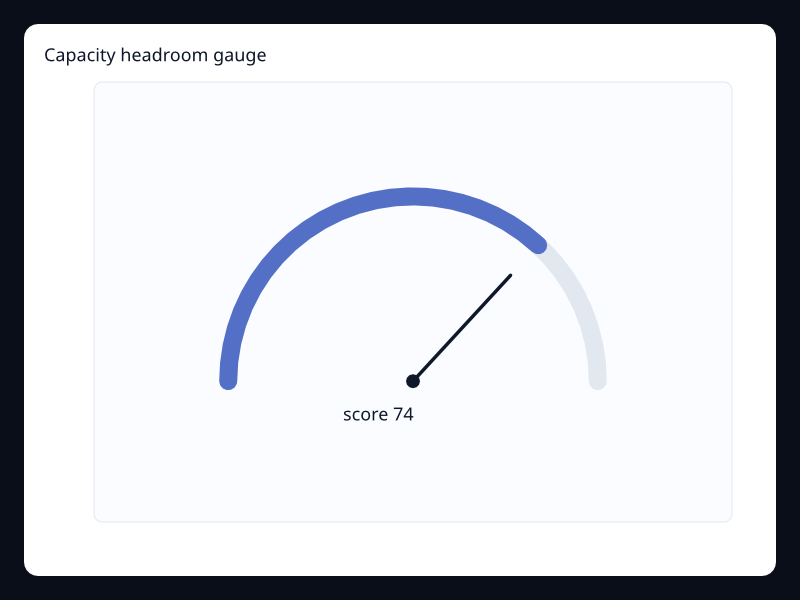
Capacity headroom gauge uses Fission Charts typed Rust data to render a production-ready radial view. Use it when headroom is the only number that matters.
Data: Typed chart data, axes, and series.
Use when: Use it when headroom is the only number that matters
Tags: gauge
Deploy health gauge
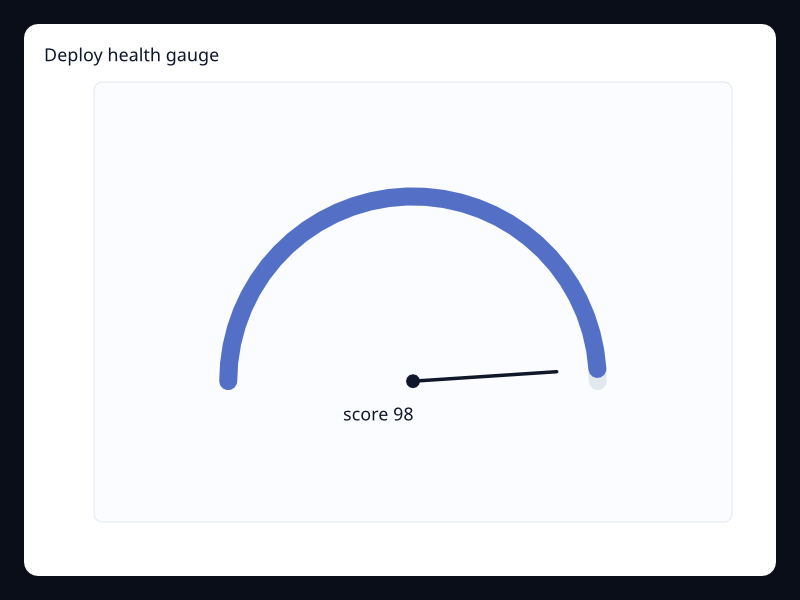
Deploy health gauge uses Fission Charts typed Rust data to render a production-ready radial view. Use it for health and readiness summaries.
Data: Typed chart data, axes, and series.
Use when: Use it for health and readiness summaries
Tags: gauge
Device donut
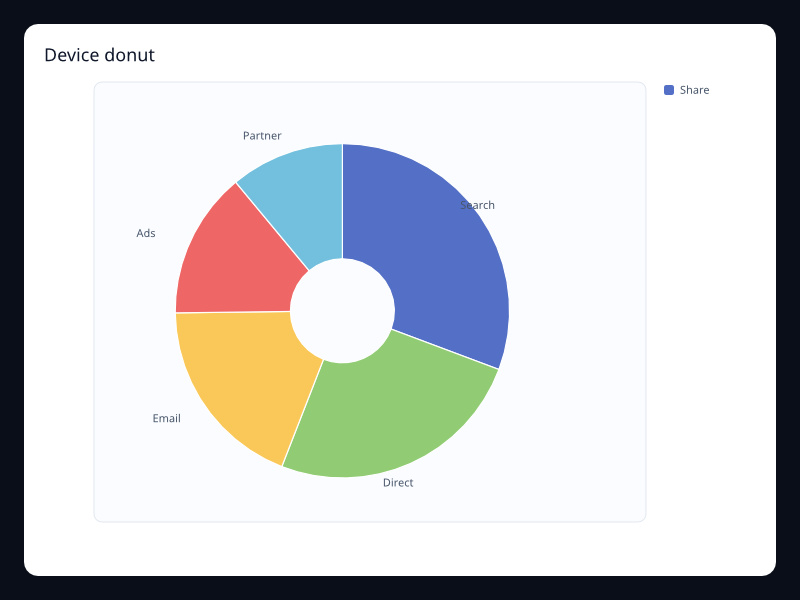
Device donut uses Fission Charts typed Rust data to render a production-ready radial view. Use it when the center can carry a total or primary label.
Data: Typed chart data, axes, and series.
Use when: Use it when the center can carry a total or primary label
Tags: donut
Expense donut
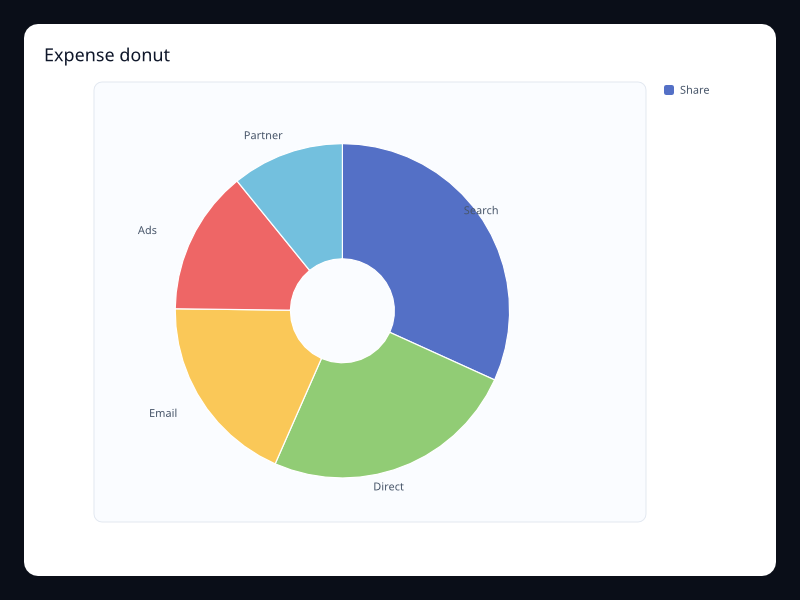
Expense donut uses Fission Charts typed Rust data to render a production-ready radial view. Use it for budget composition.
Data: Typed chart data, axes, and series.
Use when: Use it for budget composition
Tags: donut
Exposure area rose
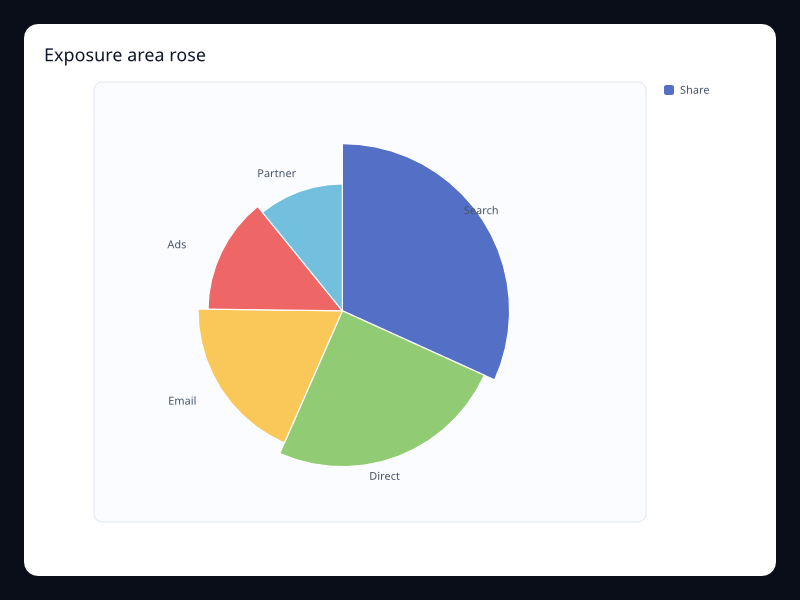
Exposure area rose uses Fission Charts typed Rust data to render a production-ready radial view. Use it when relative shape is more important than a precise angle.
Data: Typed chart data, axes, and series.
Use when: Use it when relative shape is more important than a precise angle
Tags: rose
Market rose
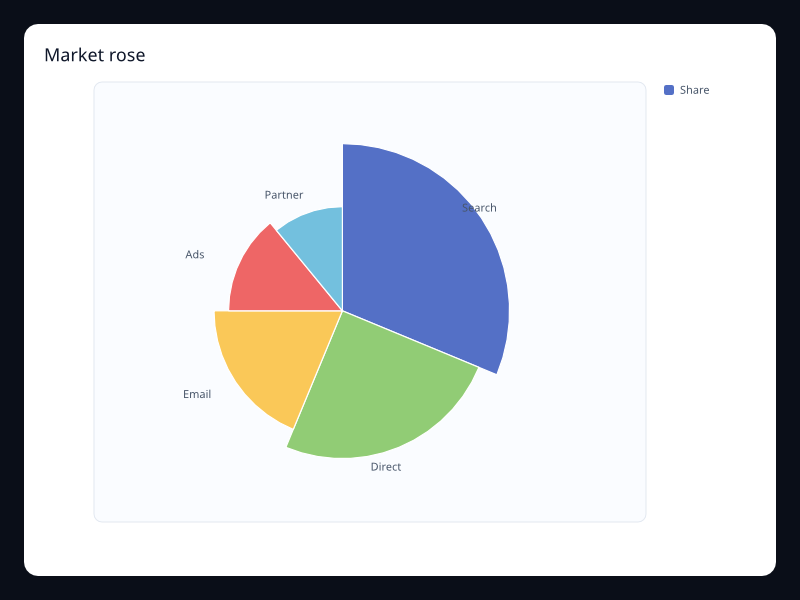
Market rose uses Fission Charts typed Rust data to render a production-ready radial view. Use it when presentation value is high and categories are few.
Data: Typed chart data, axes, and series.
Use when: Use it when presentation value is high and categories are few
Tags: rose
Plan share pie
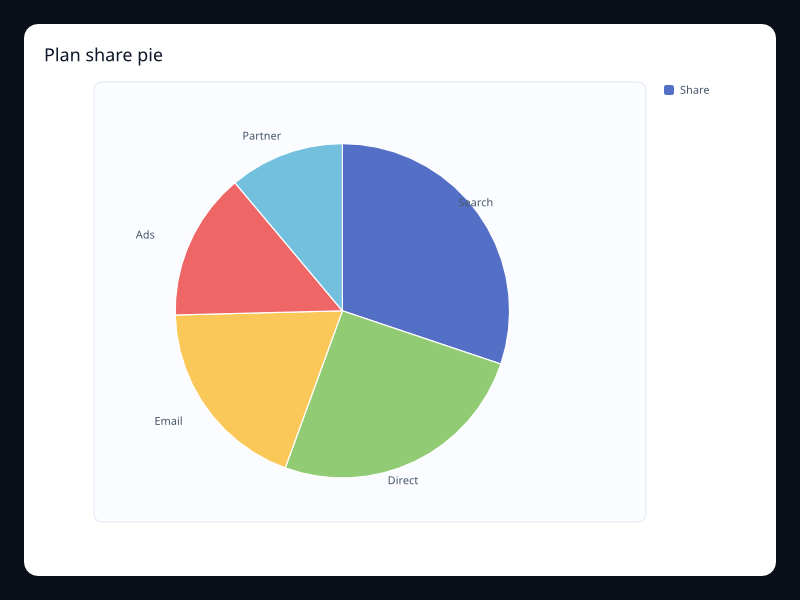
Plan share pie uses Fission Charts typed Rust data to render a production-ready radial view. Use it when part-to-whole reading is the main task.
Data: Typed chart data, axes, and series.
Use when: Use it when part-to-whole reading is the main task
Tags: pie
Revenue mix donut
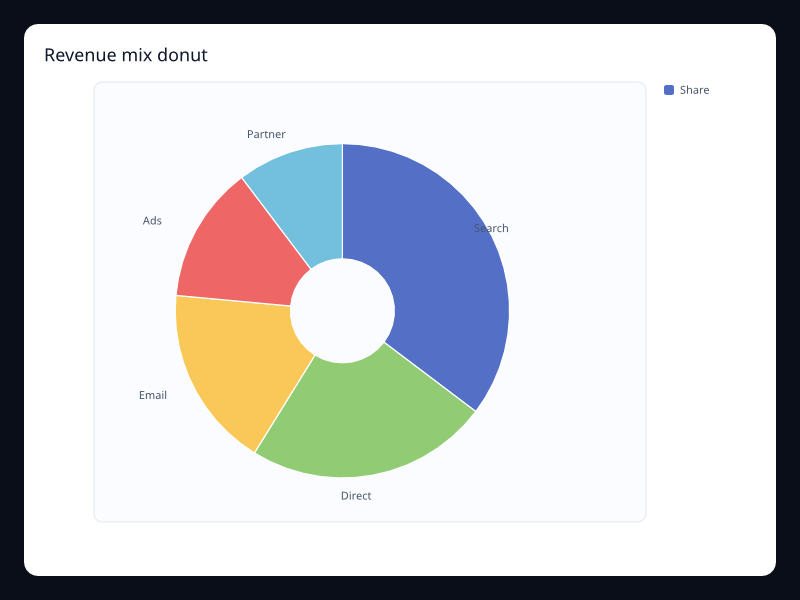
Revenue mix donut uses Fission Charts typed Rust data to render a production-ready radial view. Use it when contribution to total revenue matters.
Data: Typed chart data, axes, and series.
Use when: Use it when contribution to total revenue matters
Tags: donut
Risk rose
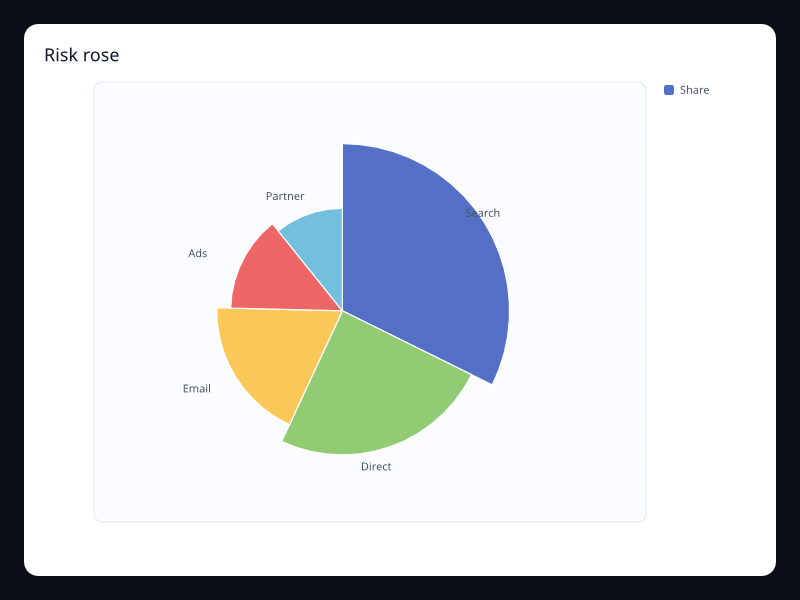
Risk rose uses Fission Charts typed Rust data to render a production-ready radial view. Use it for executive risk snapshots where visual emphasis helps.
Data: Typed chart data, axes, and series.
Use when: Use it for executive risk snapshots where visual emphasis helps
Tags: rose
Source mix pie
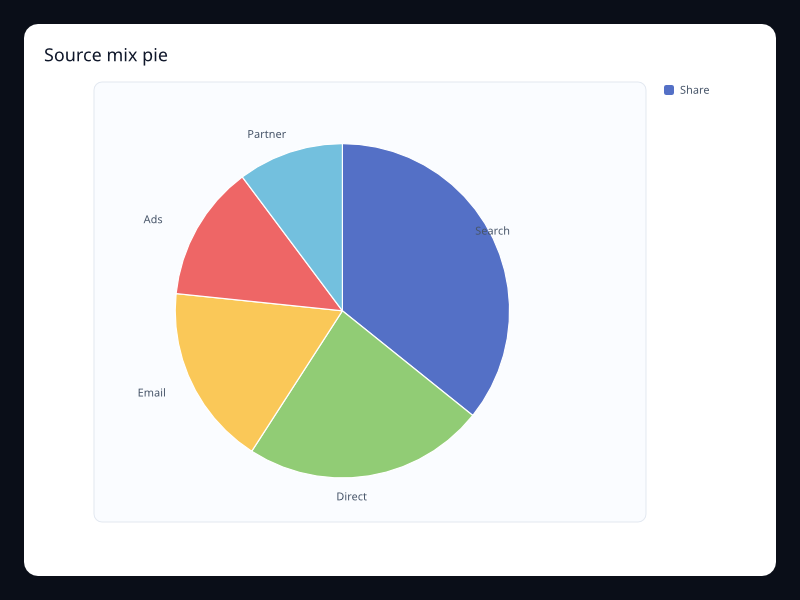
Source mix pie uses Fission Charts typed Rust data to render a production-ready radial view. Use it for small source distributions.
Data: Typed chart data, axes, and series.
Use when: Use it for small source distributions
Tags: pie
Cycle polar line
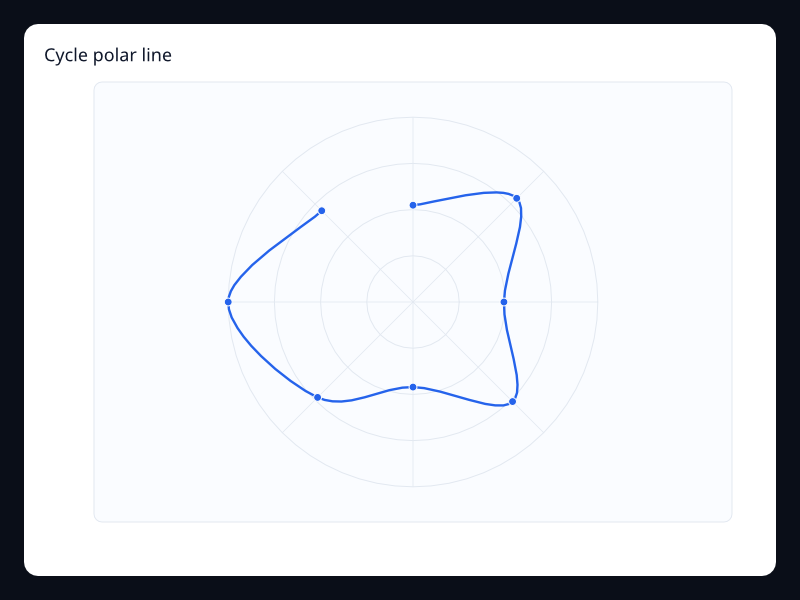
Cycle polar line uses Fission Charts typed Rust data to render a production-ready radial view. Use it for circular process metrics.
Data: Typed chart data, axes, and series.
Use when: Use it for circular process metrics
Tags: polar
Hourly load polar bars
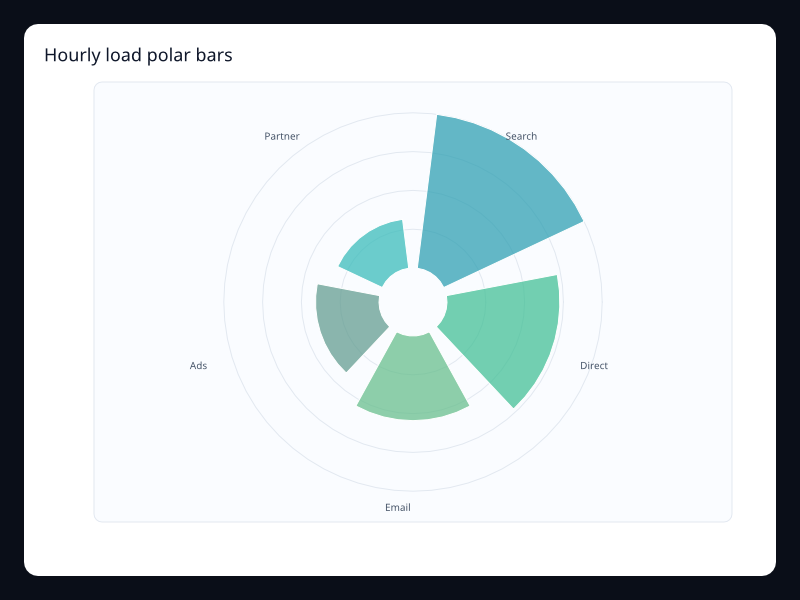
Hourly load polar bars uses Fission Charts typed Rust data to render a production-ready radial view. Use it when cyclic position is meaningful.
Data: Typed chart data, axes, and series.
Use when: Use it when cyclic position is meaningful
Tags: polar
Seasonality polar bars
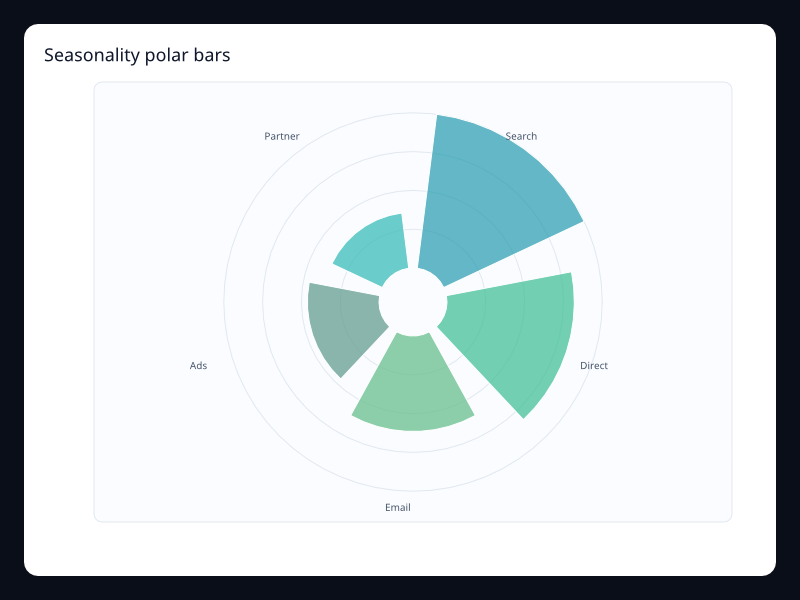
Seasonality polar bars uses Fission Charts typed Rust data to render a production-ready radial view. Use it when the shape wraps around a repeated cycle.
Data: Typed chart data, axes, and series.
Use when: Use it when the shape wraps around a repeated cycle
Tags: polar
Wind speed polar line
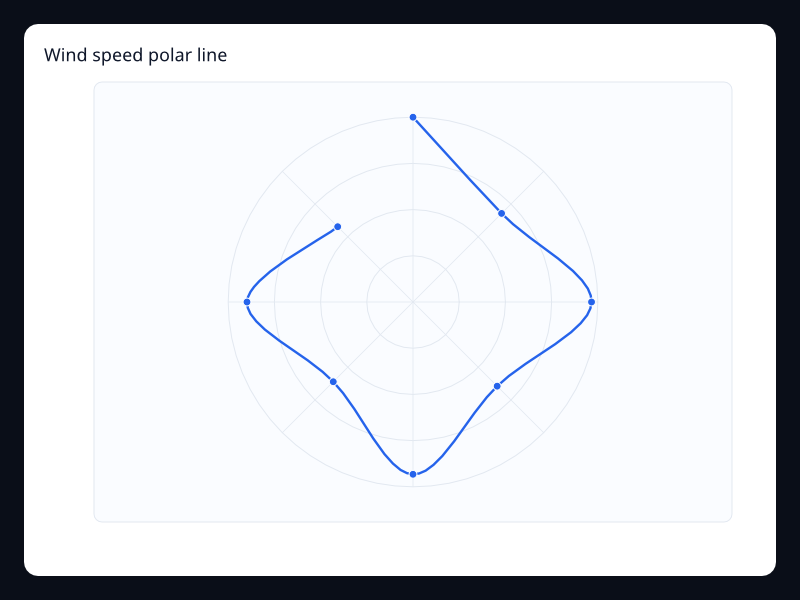
Wind speed polar line uses Fission Charts typed Rust data to render a production-ready radial view. Use it for directional or cyclic measures.
Data: Typed chart data, axes, and series.
Use when: Use it for directional or cyclic measures
Tags: polar
Platform readiness radar
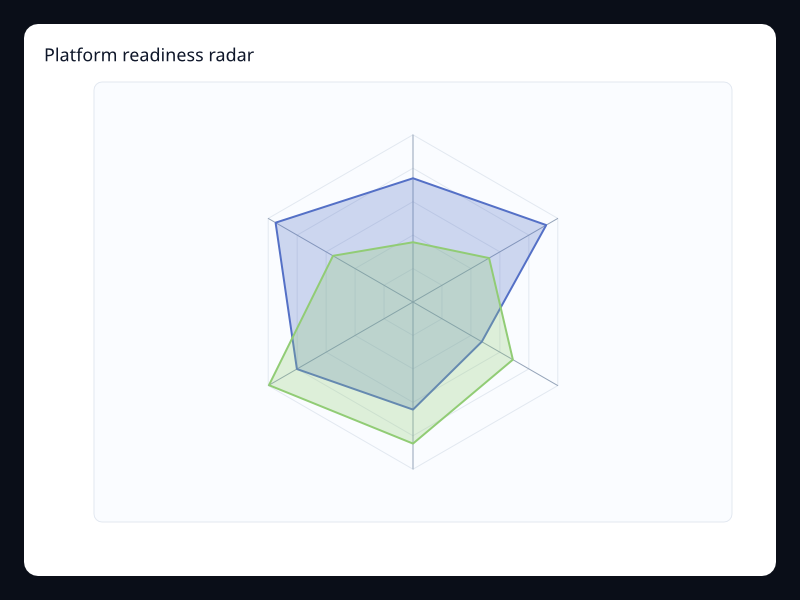
Platform readiness radar uses Fission Charts typed Rust data to render a production-ready radial view. Use it to summarize readiness across product areas.
Data: Typed chart data, axes, and series.
Use when: Use it to summarize readiness across product areas
Tags: radar
Product fit radar
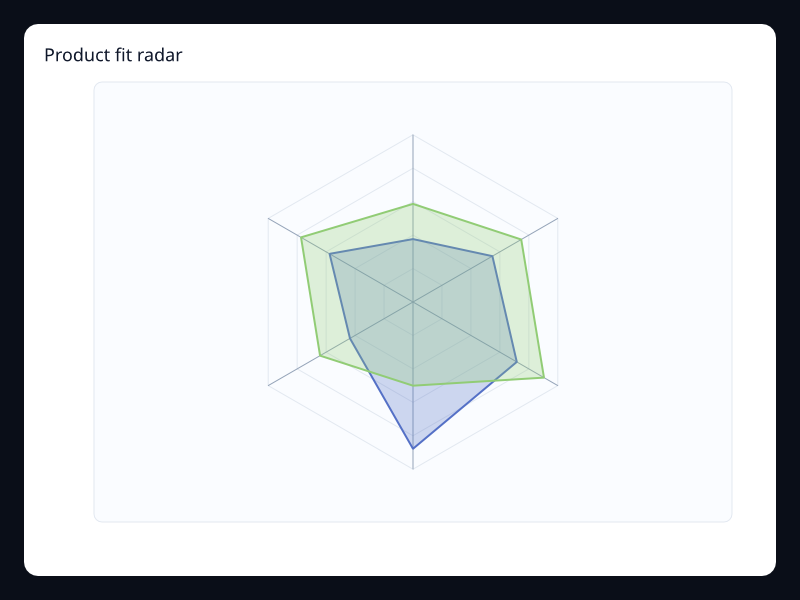
Product fit radar uses Fission Charts typed Rust data to render a production-ready radial view. Use it to compare shapes across a few dimensions.
Data: Typed chart data, axes, and series.
Use when: Use it to compare shapes across a few dimensions
Tags: radar
Service health radar
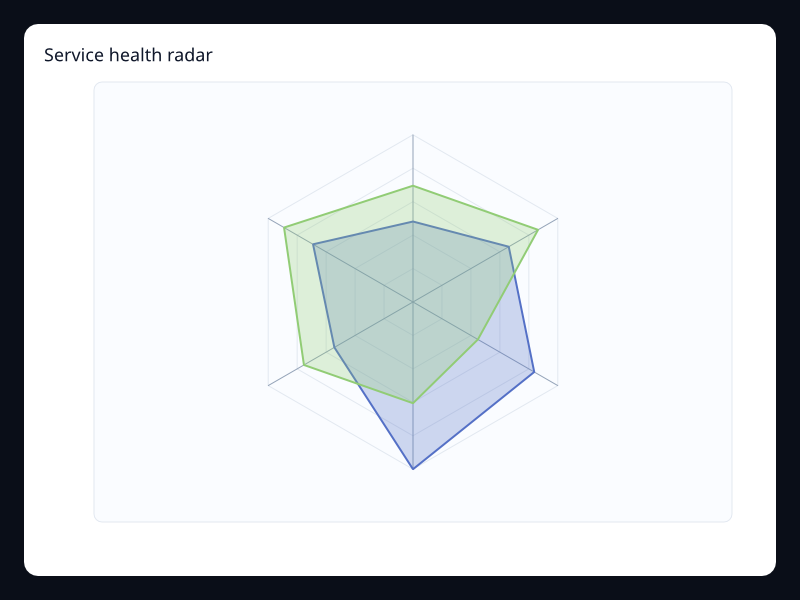
Service health radar uses Fission Charts typed Rust data to render a production-ready radial view. Use it for compact status summaries.
Data: Typed chart data, axes, and series.
Use when: Use it for compact status summaries
Tags: radar
Team balance radar
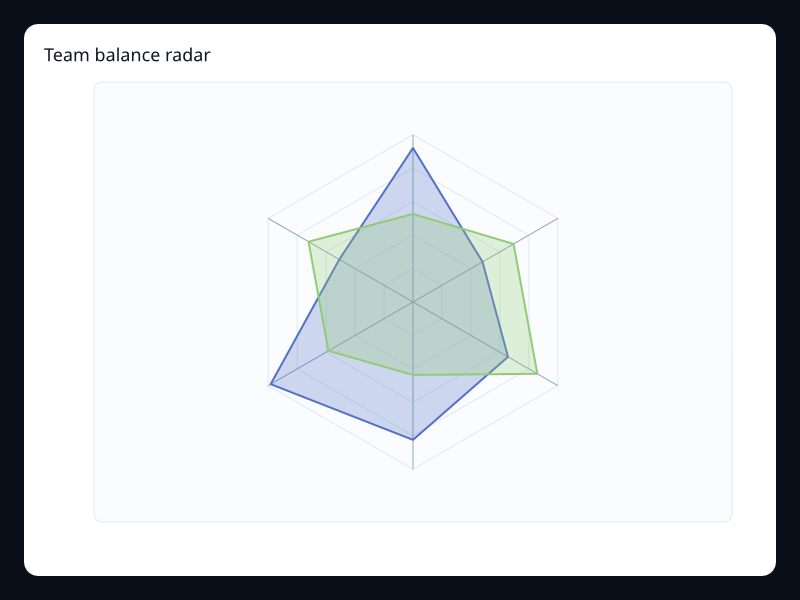
Team balance radar uses Fission Charts typed Rust data to render a production-ready radial view. Use it when balance across dimensions is the main reading.
Data: Typed chart data, axes, and series.
Use when: Use it when balance across dimensions is the main reading
Tags: radar
Radial And Polar
Gauge
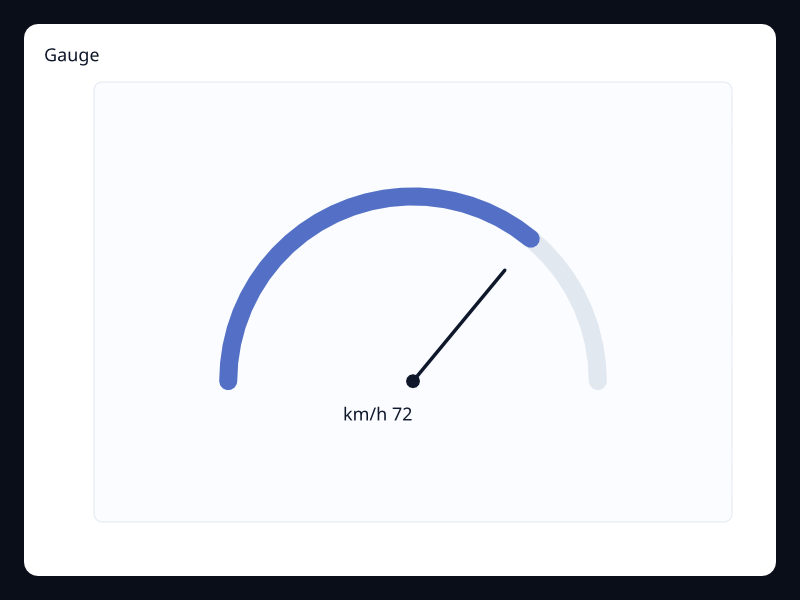
A dial-style chart for one bounded measure. Use it when the value is read as a current instrument state.
Data: Typed chart data, axes, and series.
Use when: Use it when the value is read as a current instrument state
Tags: gauge
Progress gauge
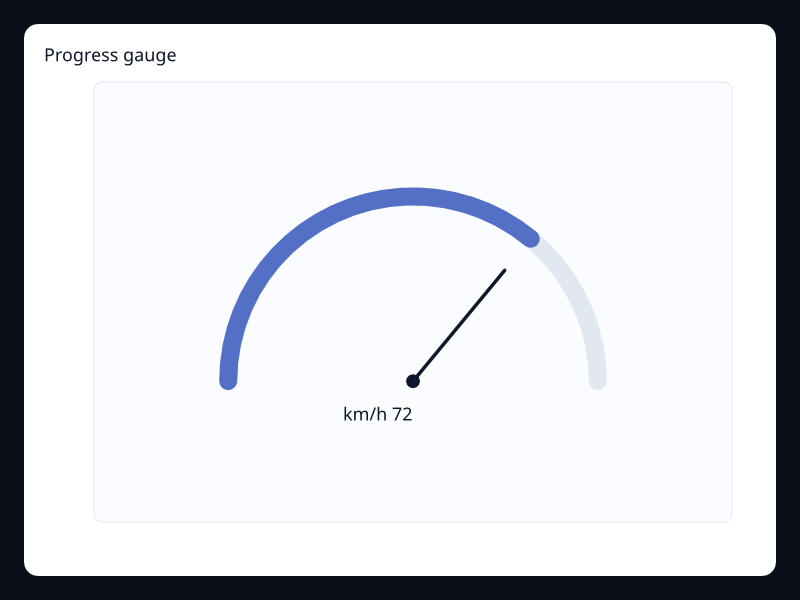
A gauge emphasizing completed amount rather than a raw number. Use it for operational progress and service health panels.
Data: Typed chart data, axes, and series.
Use when: Use it for operational progress and service health panels
Tags: gauge
Liquid fill
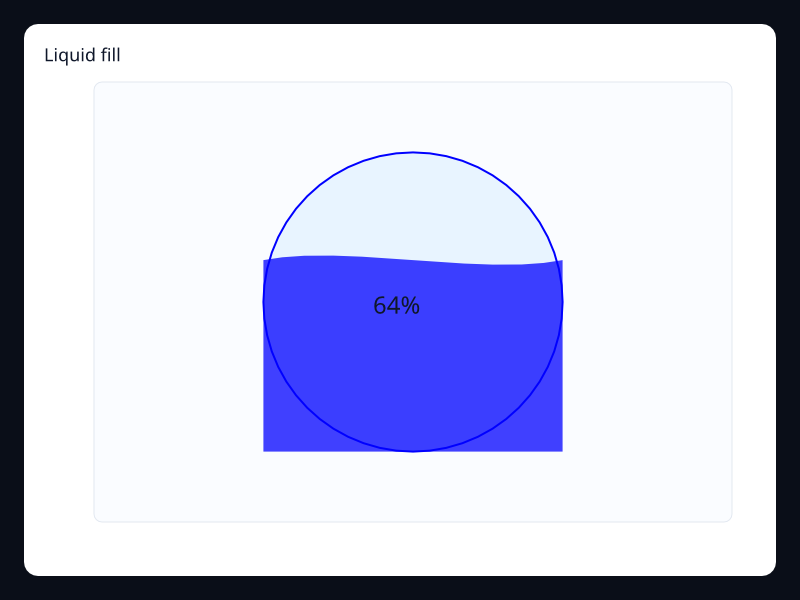
A circular fill indicator with a wave-shaped level. Use it for capacity, completion, or quota states.
Data: Typed chart data, axes, and series.
Use when: Use it for capacity, completion, or quota states
Tags: liquid
Pie
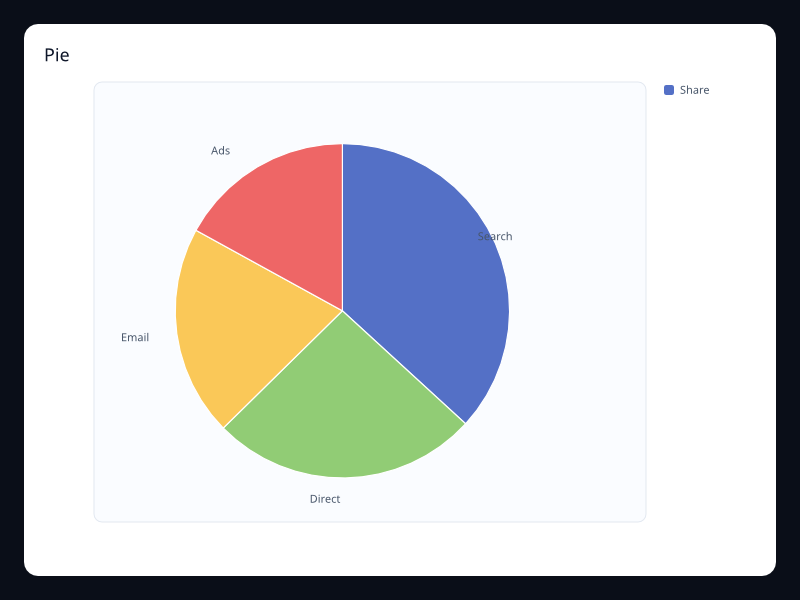
A circular part-to-whole chart. Use it for a small number of categories where the whole matters.
Data: Typed chart data, axes, and series.
Use when: Use it for a small number of categories where the whole matters
Tags: pie
Donut
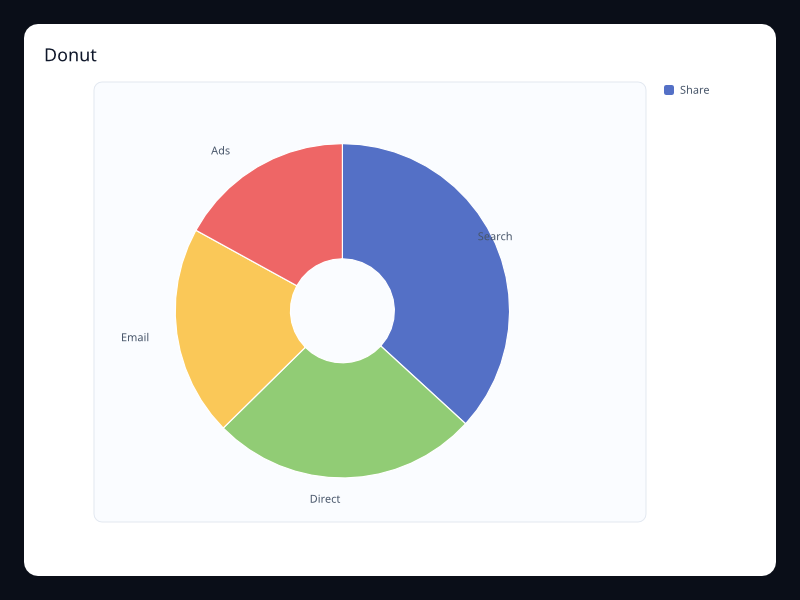
A pie chart with an open center for a total or primary label. Use it when the whole needs a central value or status.
Data: Typed chart data, axes, and series.
Use when: Use it when the whole needs a central value or status
Tags: pie
Rose by area
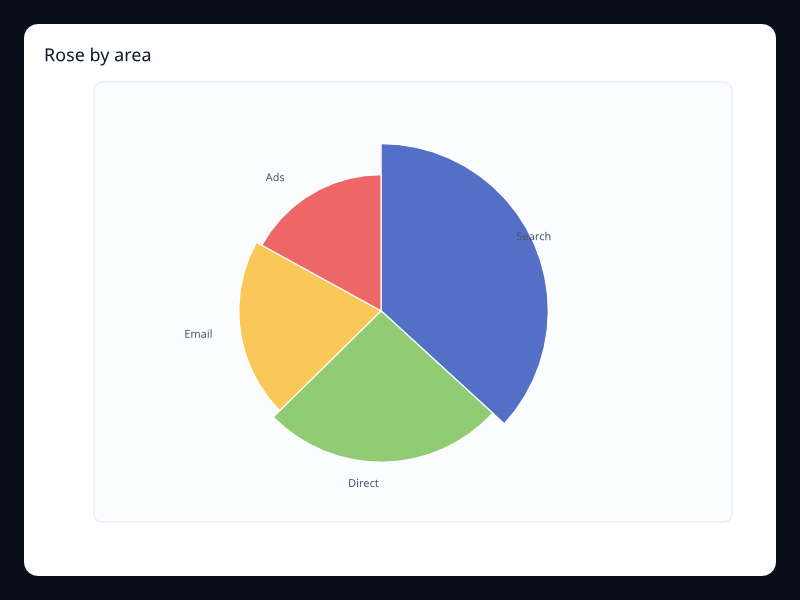
Slices use area-oriented radius scaling for a softer rose chart. Use it when rose slices should emphasize difference without making small values disappear.
Data: Typed chart data, axes, and series.
Use when: Use it when rose slices should emphasize difference without making small values disappear
Tags: pie
Rose by radius
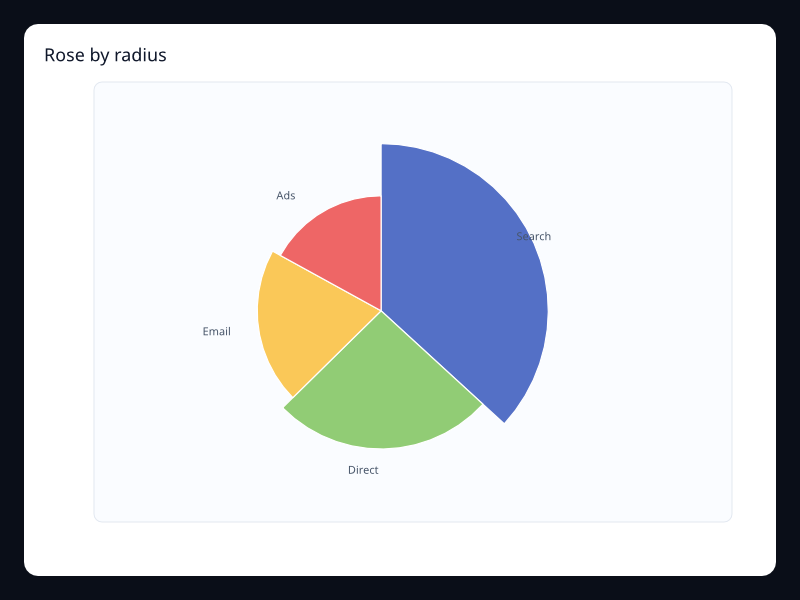
Slices use radius to make category differences more expressive. Use it for presentation-heavy part-to-whole views.
Data: Typed chart data, axes, and series.
Use when: Use it for presentation-heavy part-to-whole views
Tags: pie
Radar
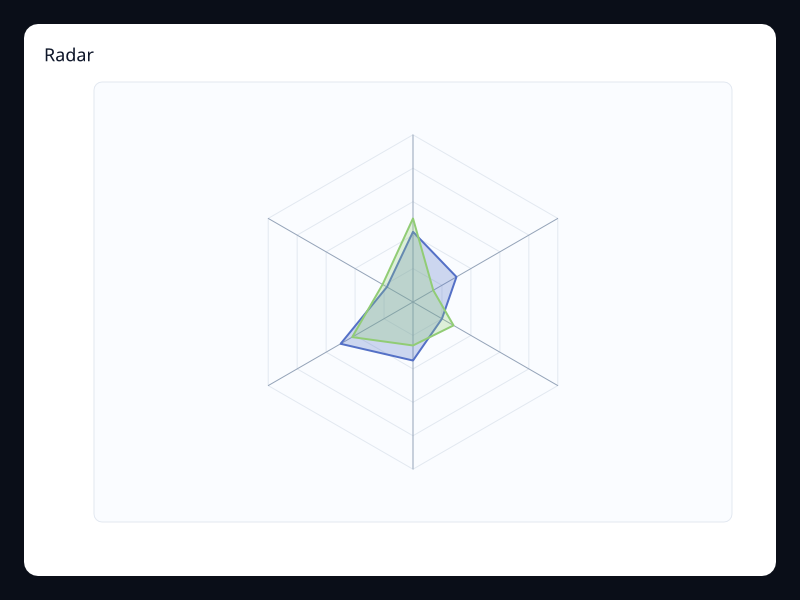
Multiple metrics plotted around a circular axis set. Use it for profile comparison across a fixed set of dimensions.
Data: Typed chart data, axes, and series.
Use when: Use it for profile comparison across a fixed set of dimensions
Tags: radar
Filled radar
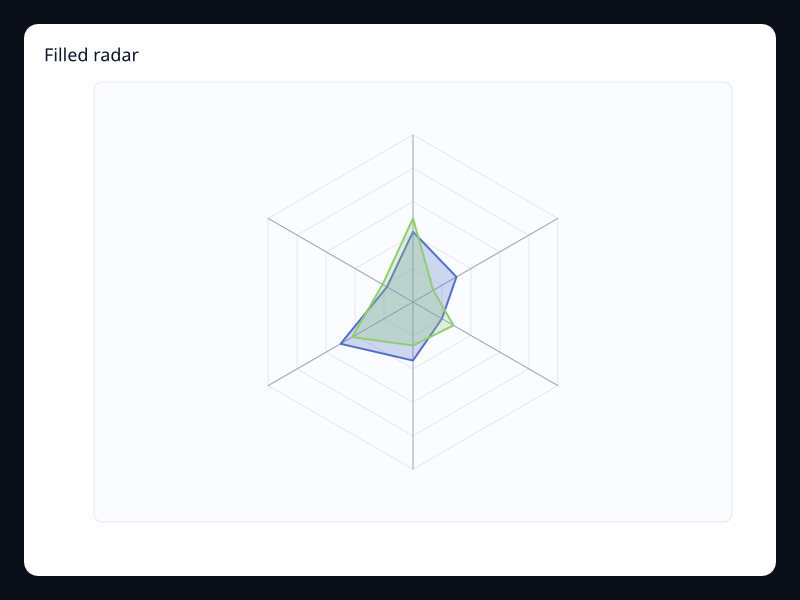
A radar chart with filled polygons for easier shape comparison. Use it when profile area and overlap should be visible.
Data: Typed chart data, axes, and series.
Use when: Use it when profile area and overlap should be visible
Tags: radar
Relationships And Hierarchy
Funnel
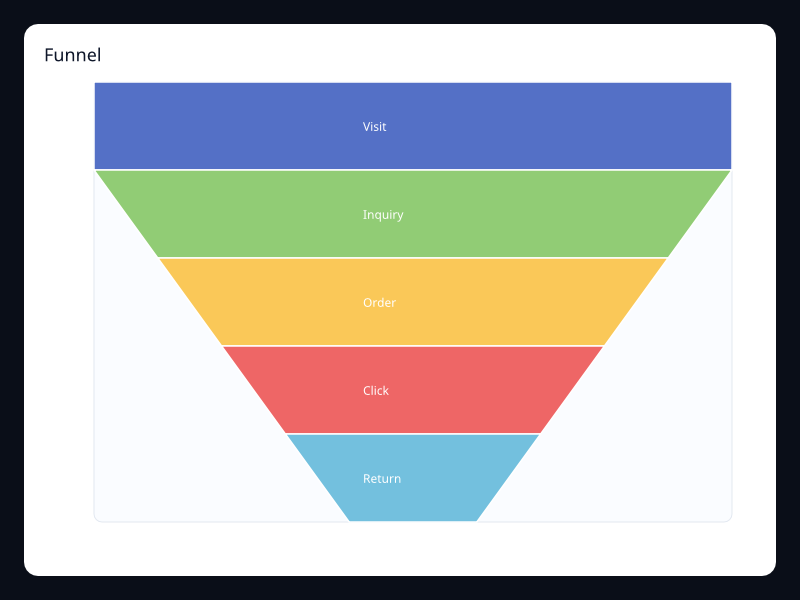
Stage values drawn as narrowing bands. Use it for conversion stages and pipeline health.
Data: Typed chart data, axes, and series.
Use when: Use it for conversion stages and pipeline health
Tags: funnel
Force graph
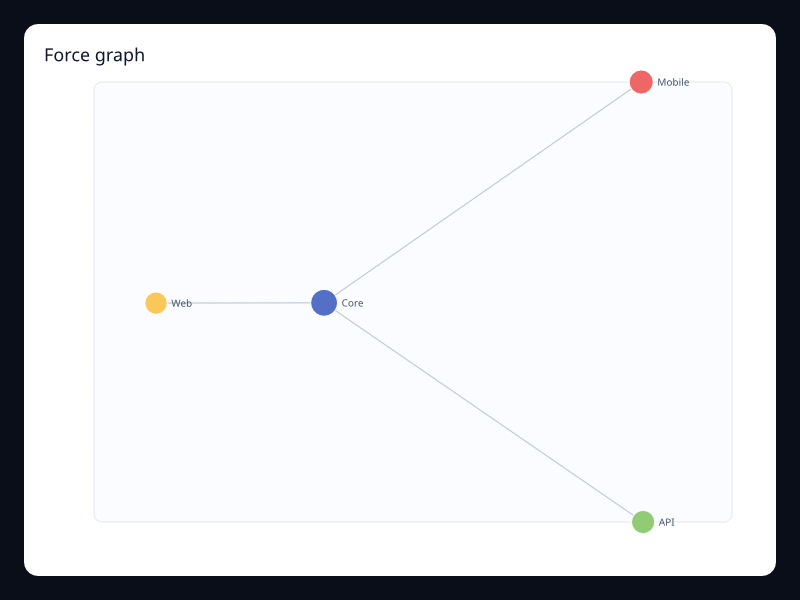
Nodes and edges arranged into a readable network. Use it for dependency, social, and topology diagrams.
Data: Typed chart data, axes, and series.
Use when: Use it for dependency, social, and topology diagrams
Tags: graph
Parallel coordinates
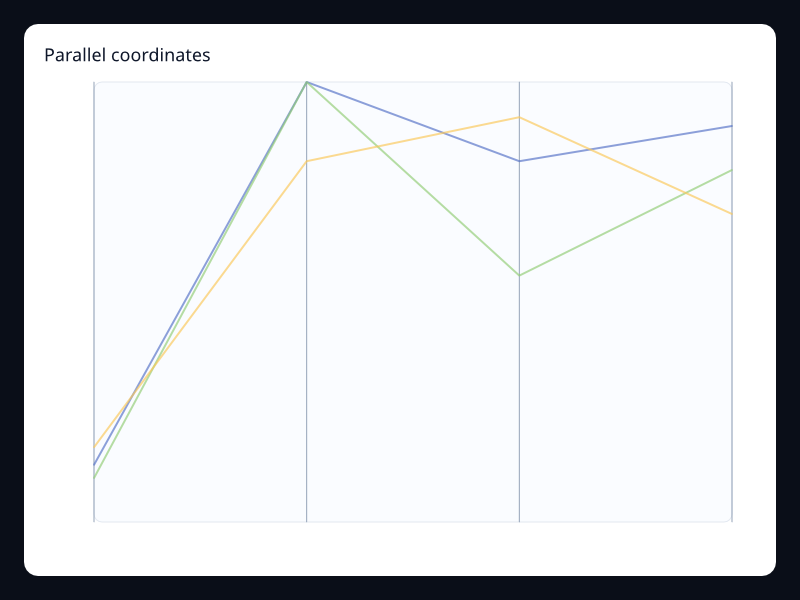
Rows drawn across multiple vertical axes. Use it for high-dimensional filtering and comparison.
Data: Typed chart data, axes, and series.
Use when: Use it for high-dimensional filtering and comparison
Tags: parallel
Sankey
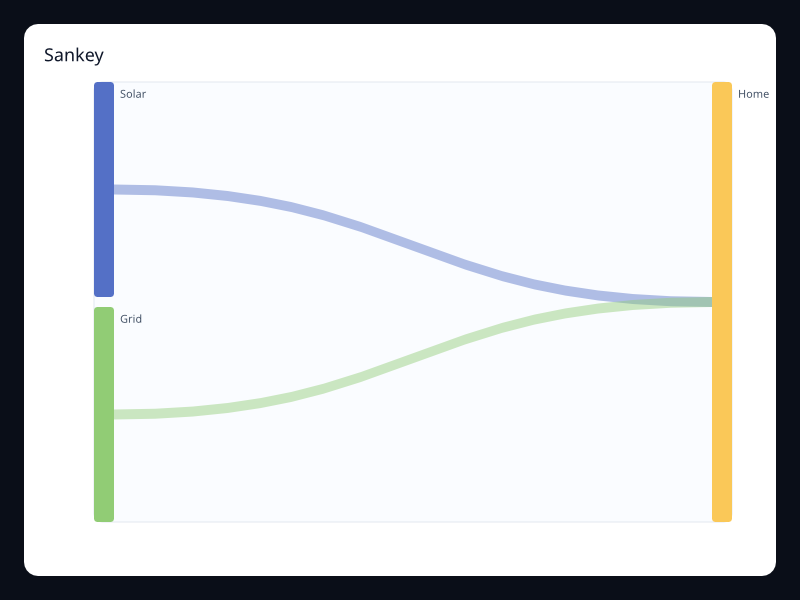
Flow between stages using bands with width. Use it for energy, revenue, and conversion flows.
Data: Typed chart data, axes, and series.
Use when: Use it for energy, revenue, and conversion flows
Tags: sankey
Sunburst
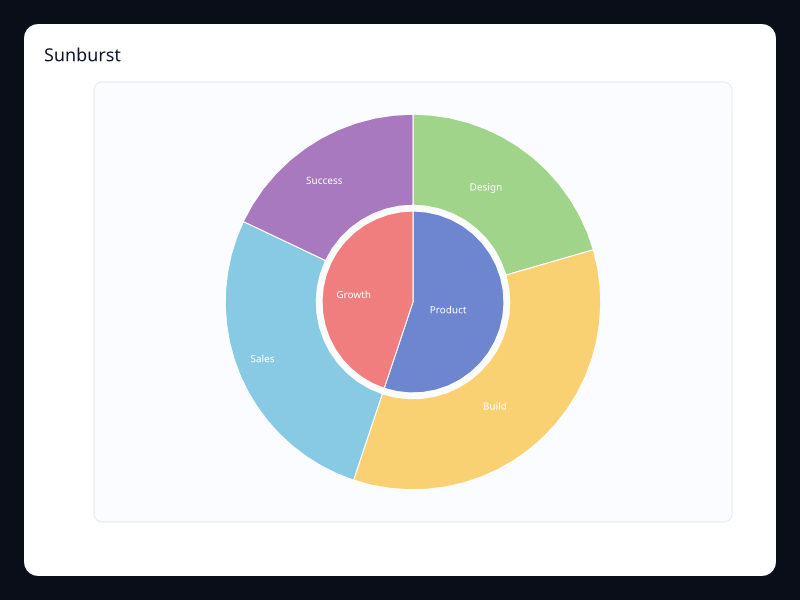
A hierarchy drawn as concentric rings. Use it when hierarchy depth should remain visible.
Data: Typed chart data, axes, and series.
Use when: Use it when hierarchy depth should remain visible
Tags: sunburst
Theme river
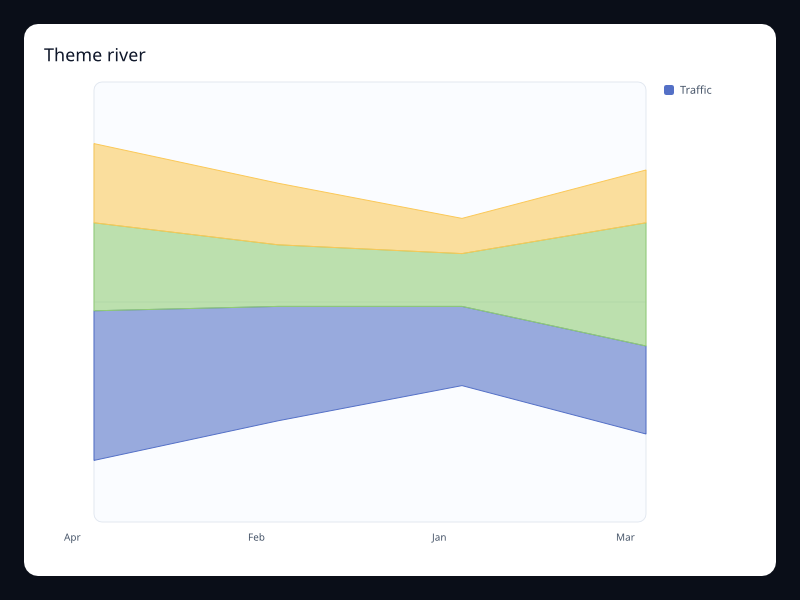
Stacked flowing bands over time. Use it when composition changes continuously over time.
Data: Typed chart data, axes, and series.
Use when: Use it when composition changes continuously over time
Tags: stream
Tree
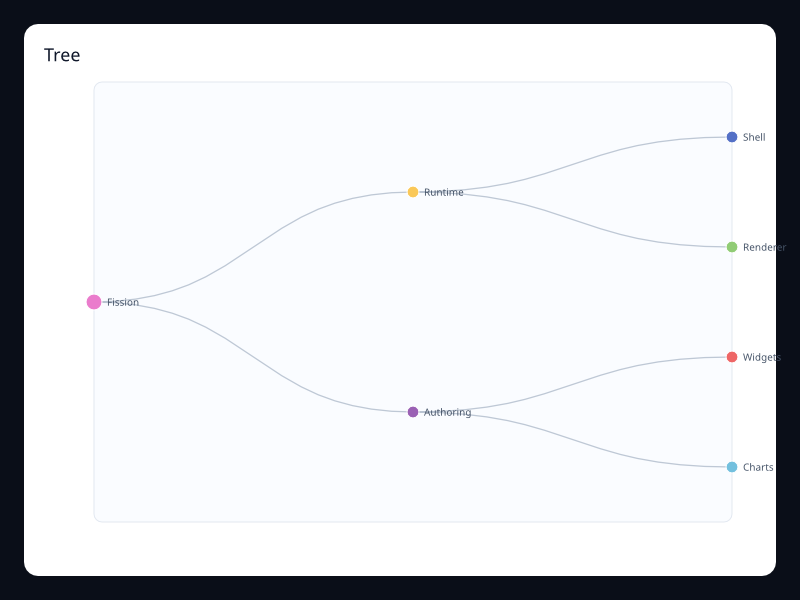
A rooted hierarchy drawn with parent-child links. Use it for navigation structures, ownership trees, and dependency drilldown.
Data: Typed chart data, axes, and series.
Use when: Use it for navigation structures, ownership trees, and dependency drilldown
Tags: tree
Radial tree
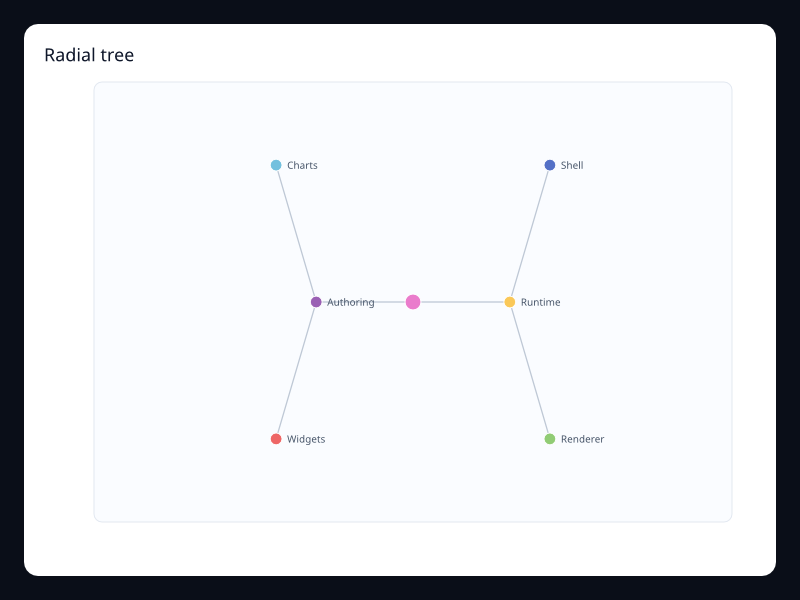
A tree layout arranged around a circle. Use it when the hierarchy is shallow and symmetry matters more than linear reading.
Data: Typed chart data, axes, and series.
Use when: Use it when the hierarchy is shallow and symmetry matters more than linear reading
Tags: tree
Treemap
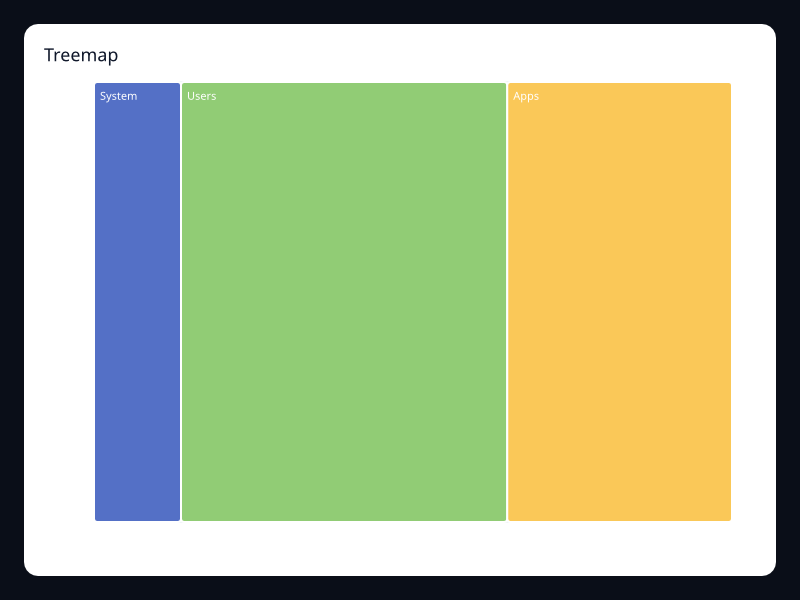
Hierarchical values packed into rectangles. Use it for storage, budgets, or part-to-whole hierarchy.
Data: Typed chart data, axes, and series.
Use when: Use it for storage, budgets, or part-to-whole hierarchy
Tags: treemap
Scatter And Statistical
Latency boxplot
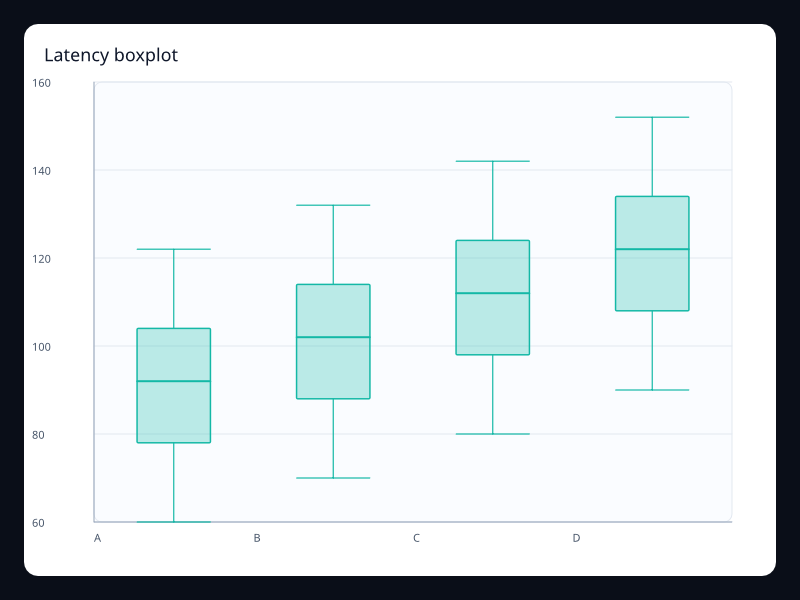
Distribution summary for latency groups. Use it when distribution matters more than averages.
Data: Typed chart data, axes, and series.
Use when: Use it when distribution matters more than averages
Tags: boxplot
Quality boxplot
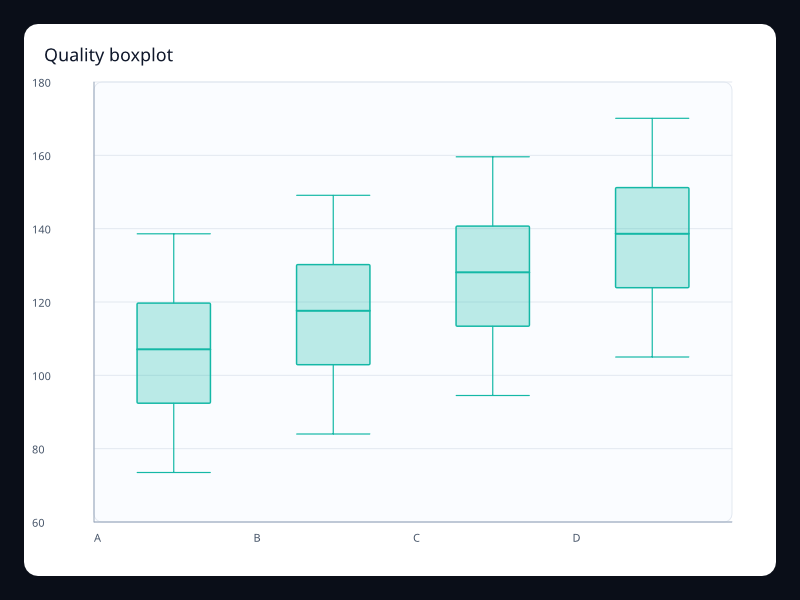
Boxplot comparing quality ranges. Use it for process quality and batch comparisons.
Data: Typed chart data, axes, and series.
Use when: Use it for process quality and batch comparisons
Tags: boxplot
Intraday candlestick
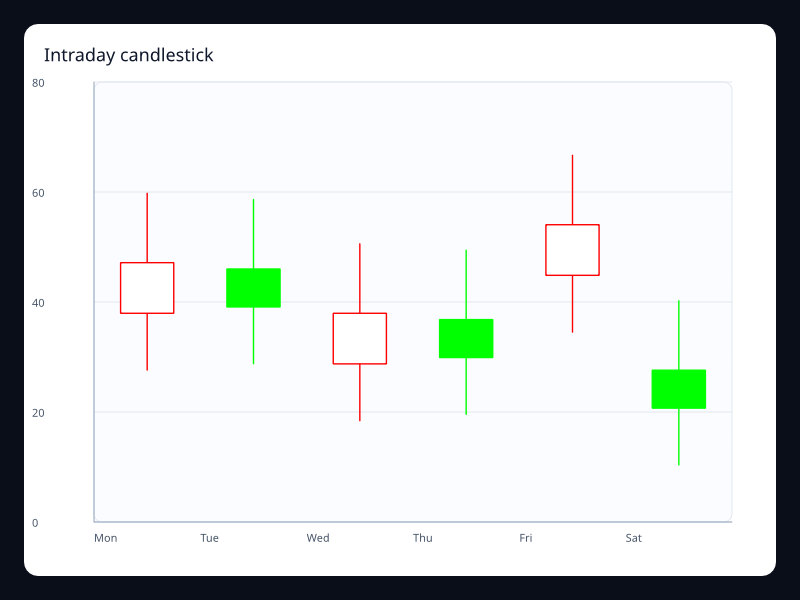
Candlestick variant with tighter movement. Use it for intraday or short-range market views.
Data: Typed chart data, axes, and series.
Use when: Use it for intraday or short-range market views
Tags: candlestick
Candlestick with movement
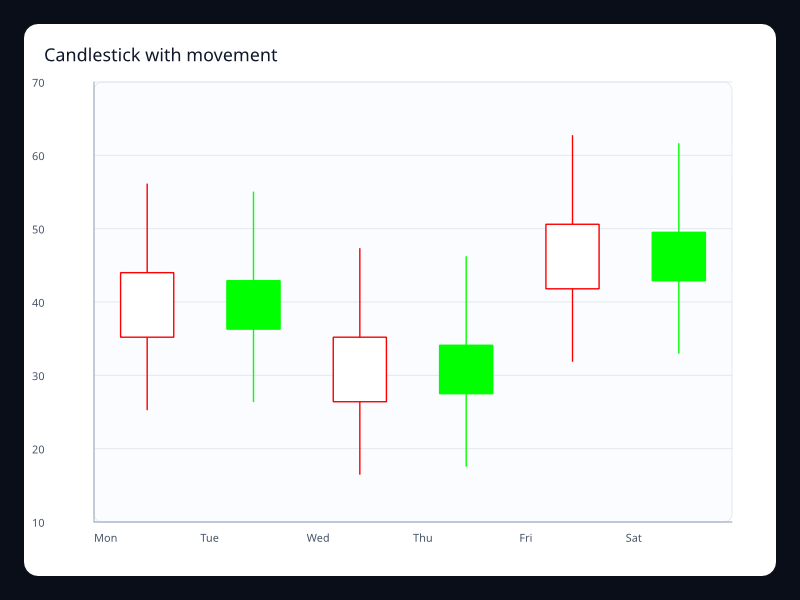
Open-close-low-high financial movement. Use it for market and range-over-time data.
Data: Typed chart data, axes, and series.
Use when: Use it for market and range-over-time data
Tags: candlestick
Conversion funnel
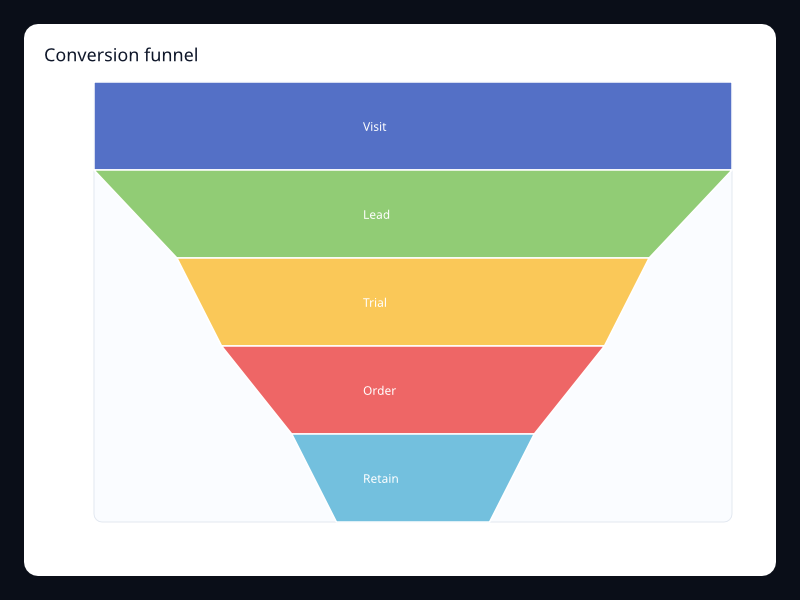
Stages drawn as a narrowing funnel. Use it for sales or onboarding funnels.
Data: Typed chart data, axes, and series.
Use when: Use it for sales or onboarding funnels
Tags: funnel
Recruiting funnel
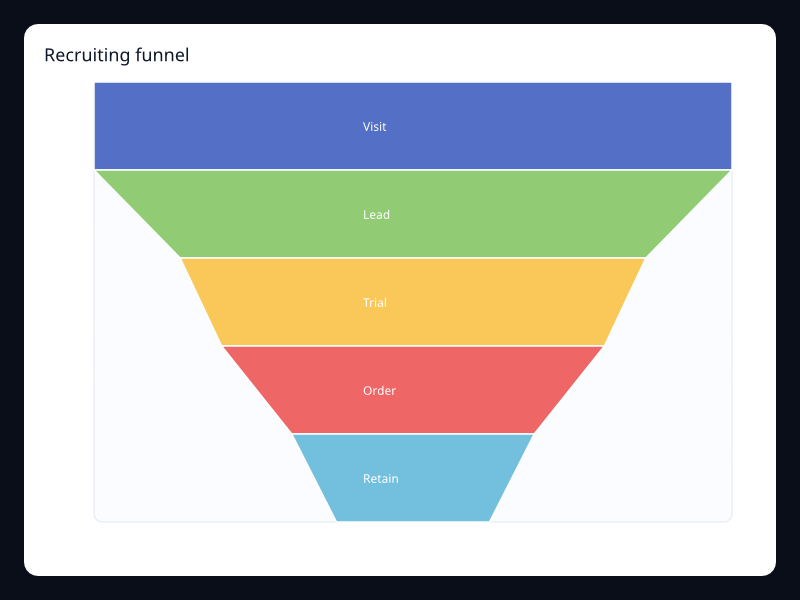
Funnel chart for hiring stages. Use it when stage drop-off matters.
Data: Typed chart data, axes, and series.
Use when: Use it when stage drop-off matters
Tags: funnel
Product parallel coordinates
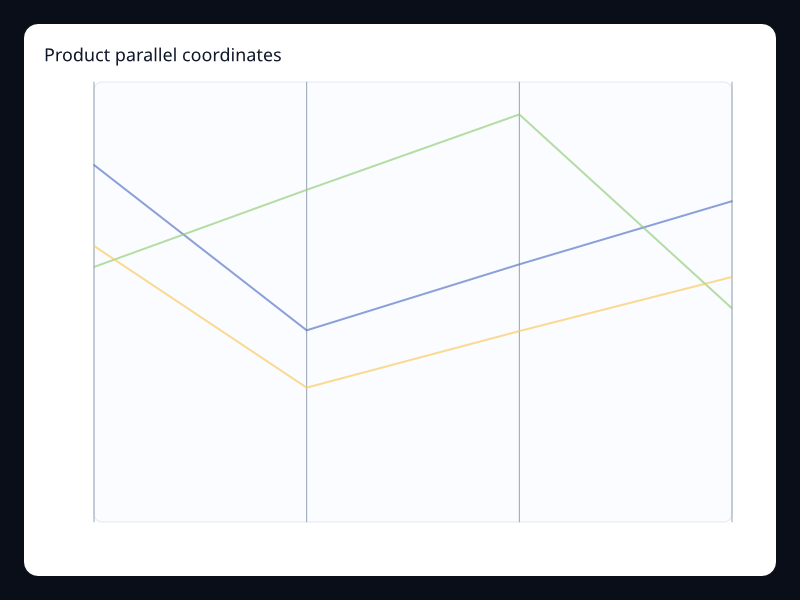
Rows crossing multiple dimensions. Use it for multidimensional comparison.
Data: Typed chart data, axes, and series.
Use when: Use it for multidimensional comparison
Tags: parallel
Quality parallel coordinates
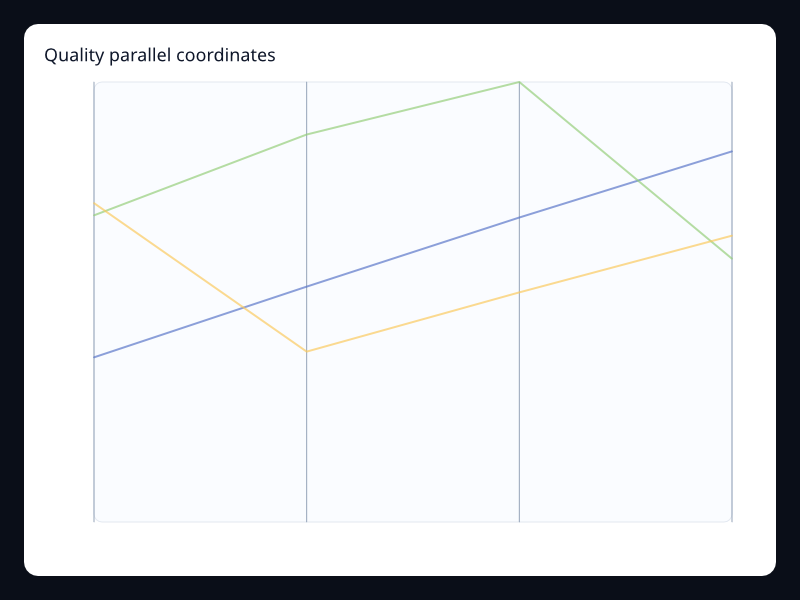
Parallel coordinates for quality dimensions. Use it for filtering and comparing profiles.
Data: Typed chart data, axes, and series.
Use when: Use it for filtering and comparing profiles
Tags: parallel
Market bubble chart
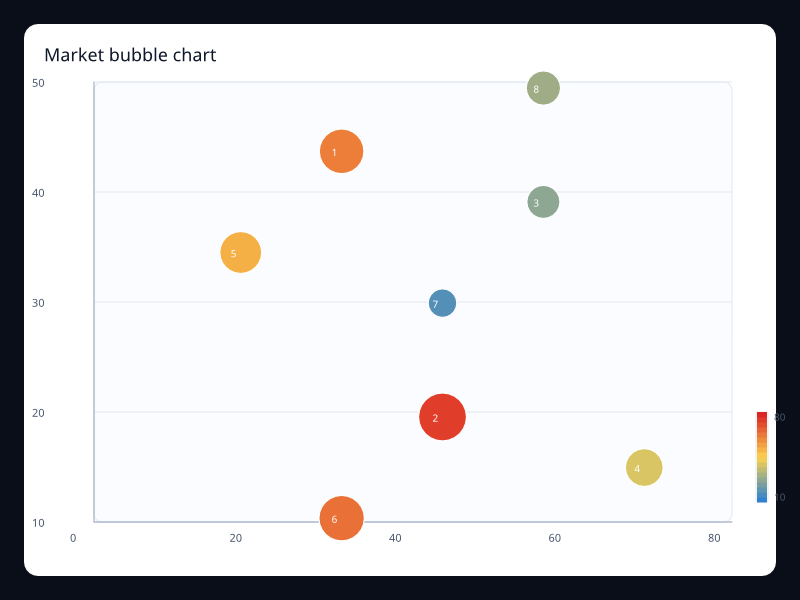
Bubble chart encoding market size as radius. Use it for three-dimensional business comparisons.
Data: Typed chart data, axes, and series.
Use when: Use it for three-dimensional business comparisons
Tags: scatter
Scatter clusters
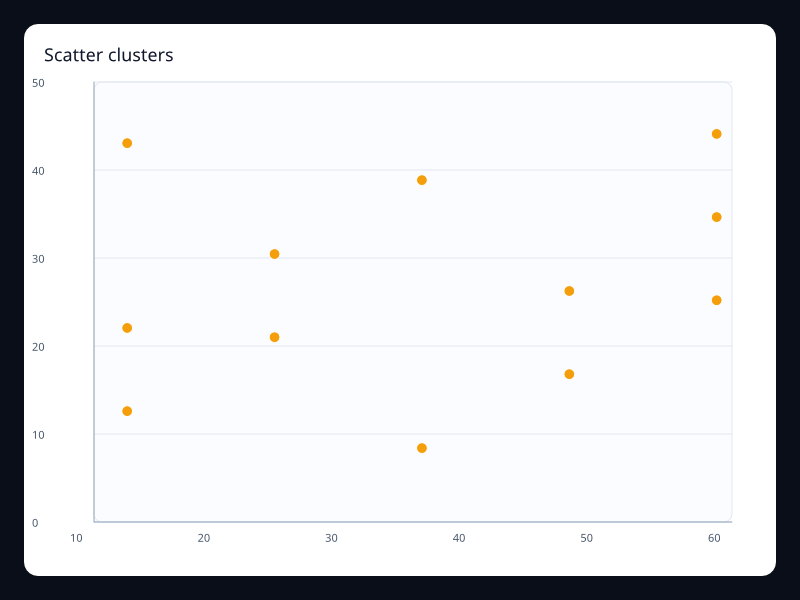
Point cloud showing clustered observations. Use it for correlation and clustering.
Data: Typed chart data, axes, and series.
Use when: Use it for correlation and clustering
Tags: scatter
Scatter outliers
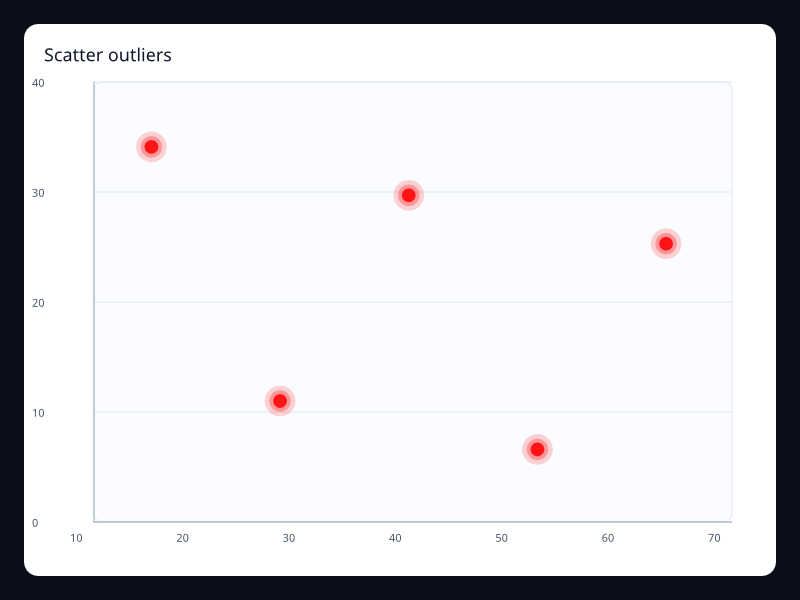
Scatter chart with emphasized outlier points. Use it to make exceptions visible.
Data: Typed chart data, axes, and series.
Use when: Use it to make exceptions visible
Tags: scatter
Risk return scatter
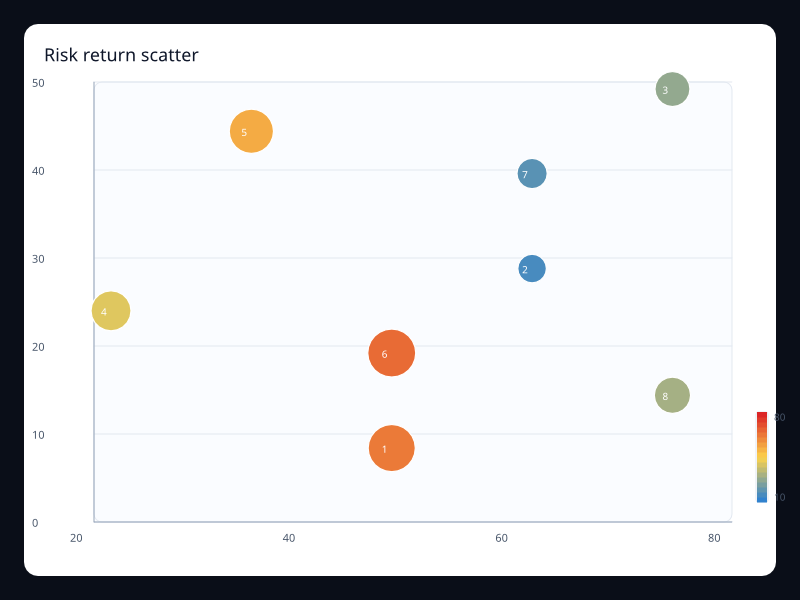
Scatter chart with bubble size for exposure. Use it for portfolio-style comparisons.
Data: Typed chart data, axes, and series.
Use when: Use it for portfolio-style comparisons
Tags: scatter
Distribution single axis
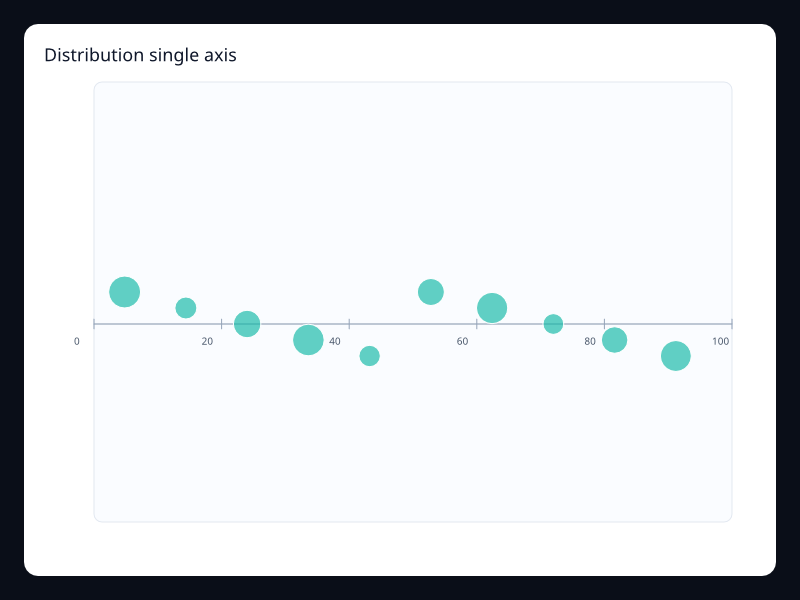
Weighted samples on one numeric scale. Use it when a second axis adds noise.
Data: Typed chart data, axes, and series.
Use when: Use it when a second axis adds noise
Tags: singleAxis
Event single axis
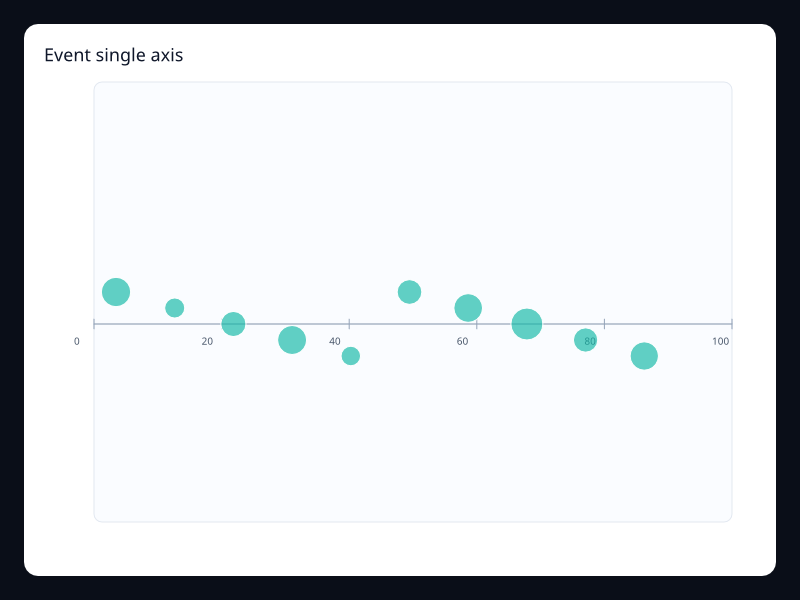
Weighted events along a single timeline. Use it for event density and distributions.
Data: Typed chart data, axes, and series.
Use when: Use it for event density and distributions
Tags: singleAxis
Statistical
API latency boxplot
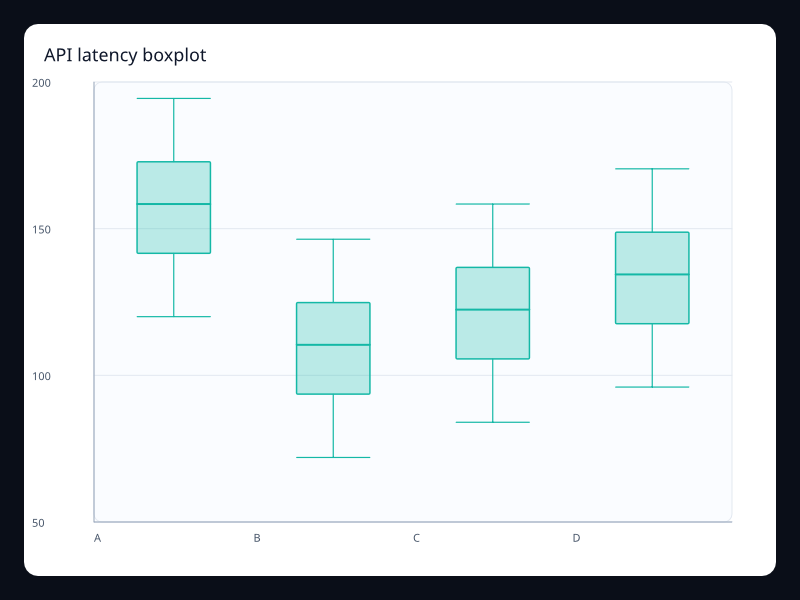
API latency boxplot uses Fission Charts typed Rust data to render a production-ready statistical view. Use it to compare distributions instead of averages.
Data: Typed chart data, axes, and series.
Use when: Use it to compare distributions instead of averages
Tags: boxplot
Quality spread boxplot
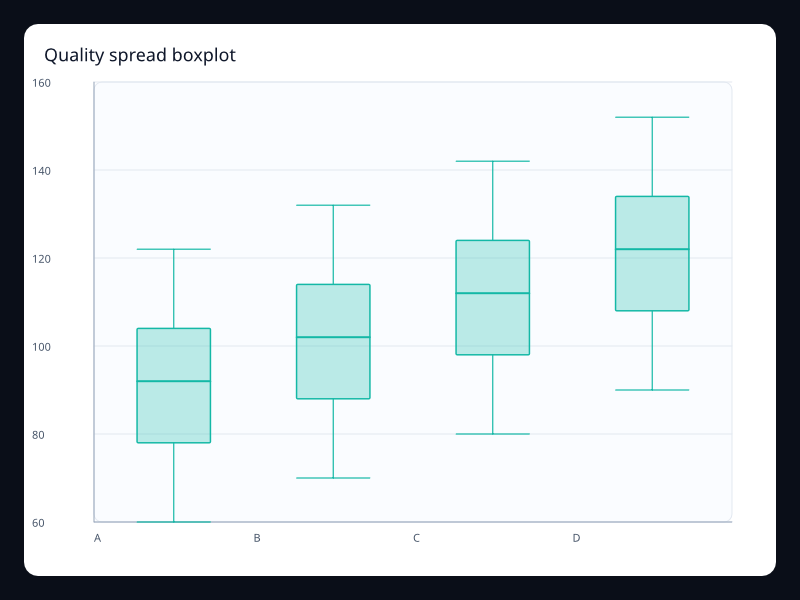
Quality spread boxplot uses Fission Charts typed Rust data to render a production-ready statistical view. Use it when spread and outliers matter.
Data: Typed chart data, axes, and series.
Use when: Use it when spread and outliers matter
Tags: boxplot
Region spread boxplot
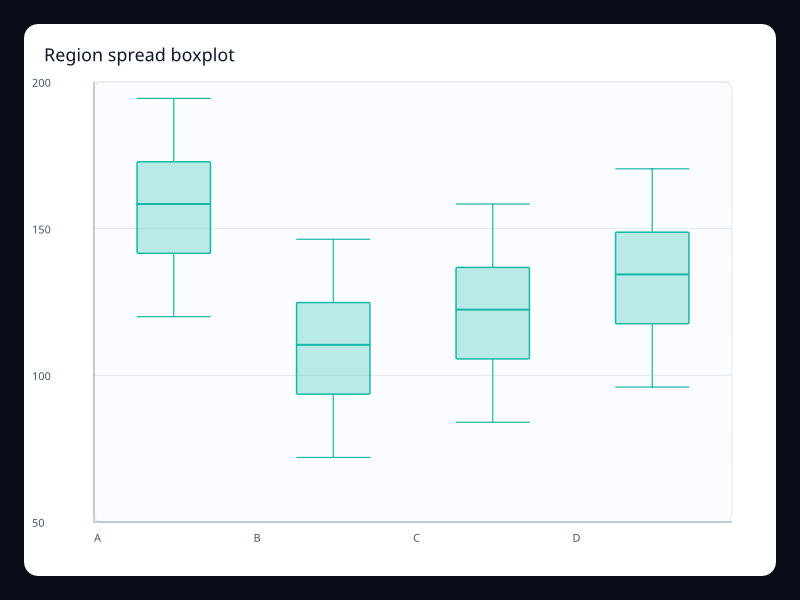
Region spread boxplot uses Fission Charts typed Rust data to render a production-ready statistical view. Use it for distribution comparison across regions.
Data: Typed chart data, axes, and series.
Use when: Use it for distribution comparison across regions
Tags: boxplot
Customer value bubbles
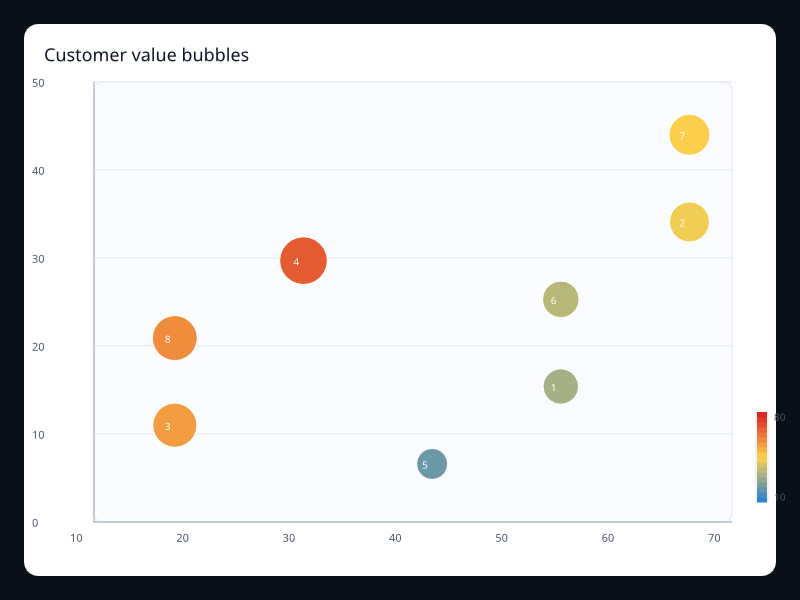
Customer value bubbles uses Fission Charts typed Rust data to render a production-ready statistical view. Use it when business value should influence point size.
Data: Typed chart data, axes, and series.
Use when: Use it when business value should influence point size
Tags: bubble
Crypto session candlestick
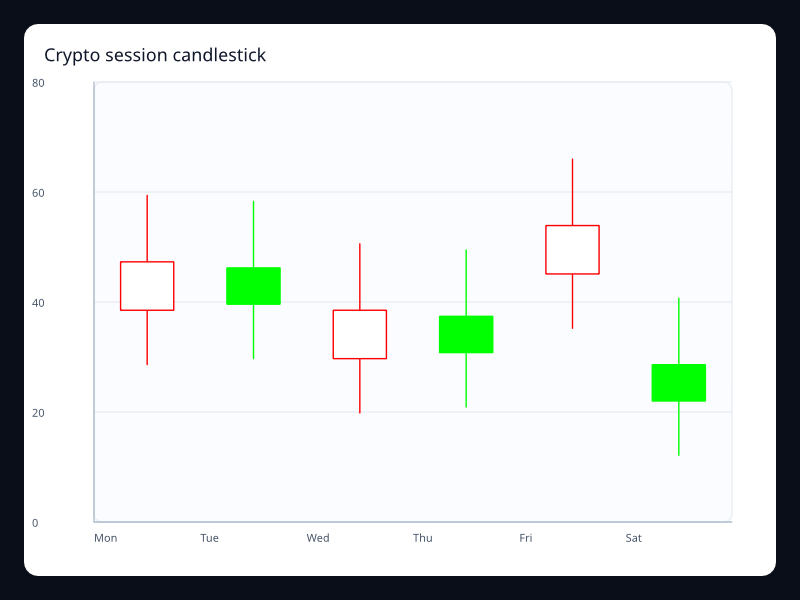
Crypto session candlestick uses Fission Charts typed Rust data to render a production-ready statistical view. Use it when price direction and range must be visible together.
Data: Typed chart data, axes, and series.
Use when: Use it when price direction and range must be visible together
Tags: candlestick
Equity session candlestick
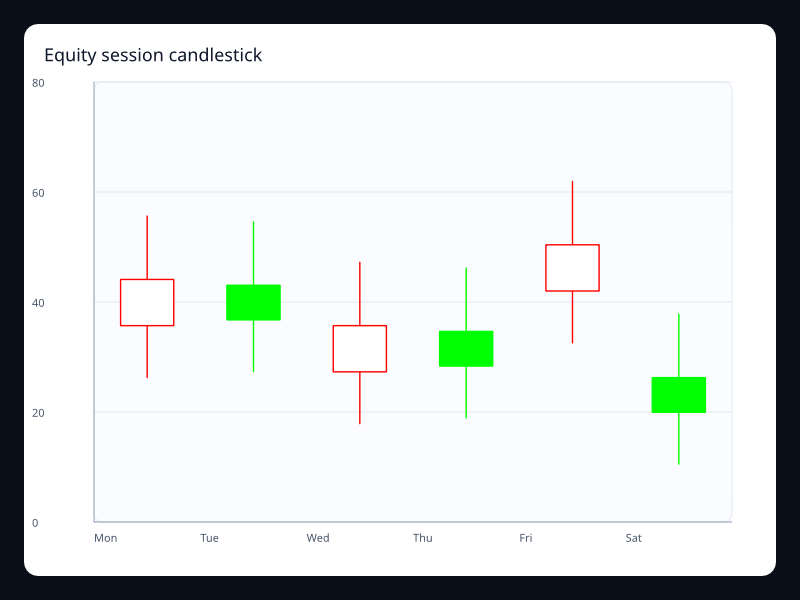
Equity session candlestick uses Fission Charts typed Rust data to render a production-ready statistical view. Use it for financial price movement.
Data: Typed chart data, axes, and series.
Use when: Use it for financial price movement
Tags: candlestick
Volume shift candlestick
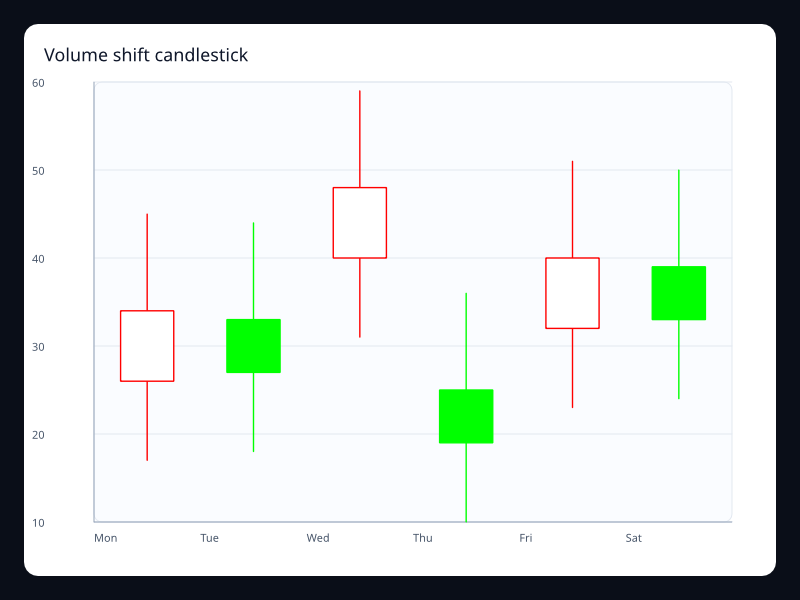
Volume shift candlestick uses Fission Charts typed Rust data to render a production-ready statistical view. Use it when directional change and range both matter.
Data: Typed chart data, axes, and series.
Use when: Use it when directional change and range both matter
Tags: candlestick
Activation funnel
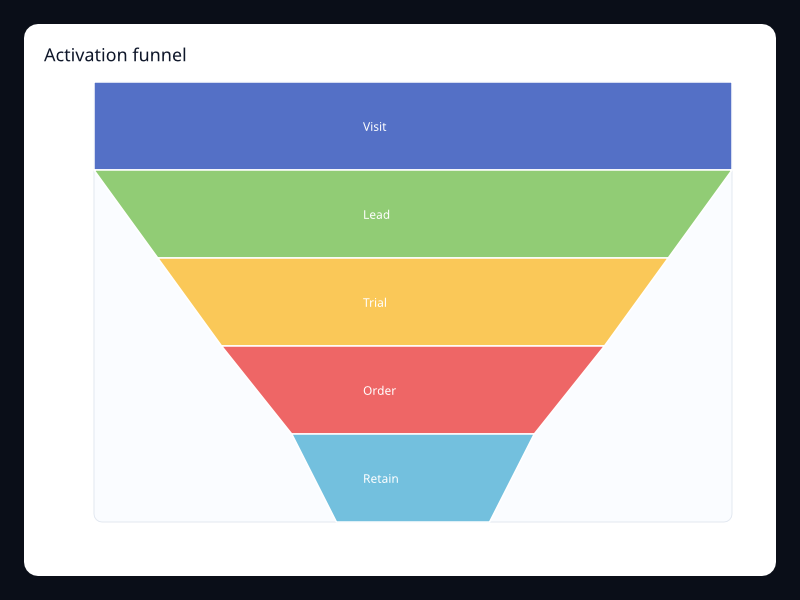
Activation funnel uses Fission Charts typed Rust data to render a production-ready statistical view. Use it when conversion loss matters more than a shared axis.
Data: Typed chart data, axes, and series.
Use when: Use it when conversion loss matters more than a shared axis
Tags: funnel
Support resolution funnel
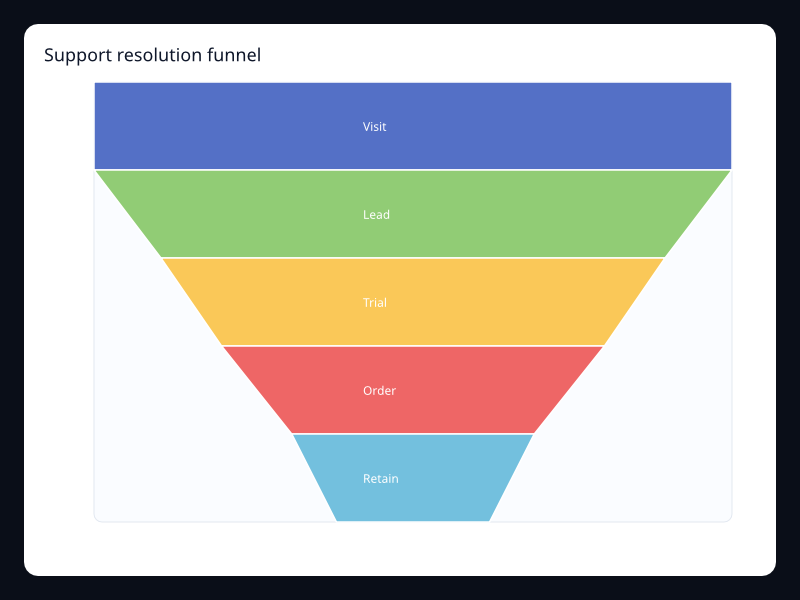
Support resolution funnel uses Fission Charts typed Rust data to render a production-ready statistical view. Use it for operational process attrition.
Data: Typed chart data, axes, and series.
Use when: Use it for operational process attrition
Tags: funnel
Device quality parallel
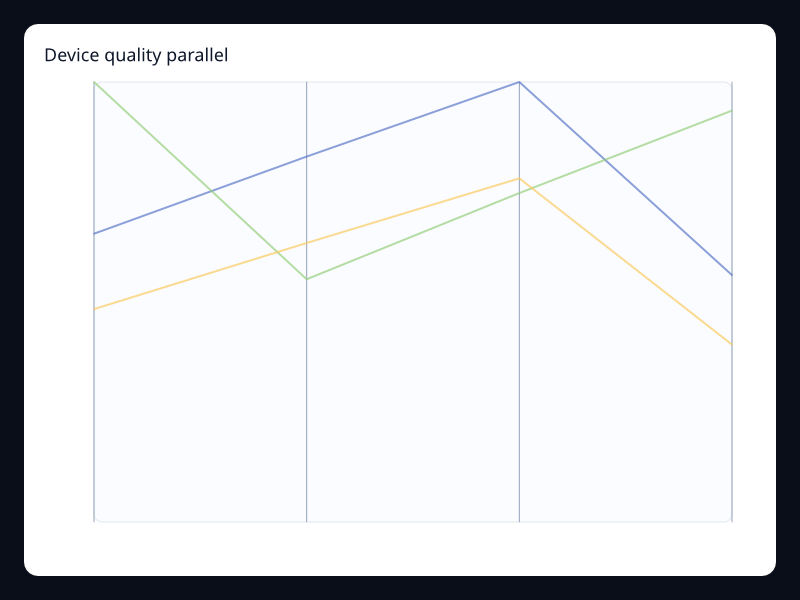
Device quality parallel uses Fission Charts typed Rust data to render a production-ready statistical view. Use it when each item has several independent measures.
Data: Typed chart data, axes, and series.
Use when: Use it when each item has several independent measures
Tags: parallel
Plan comparison parallel
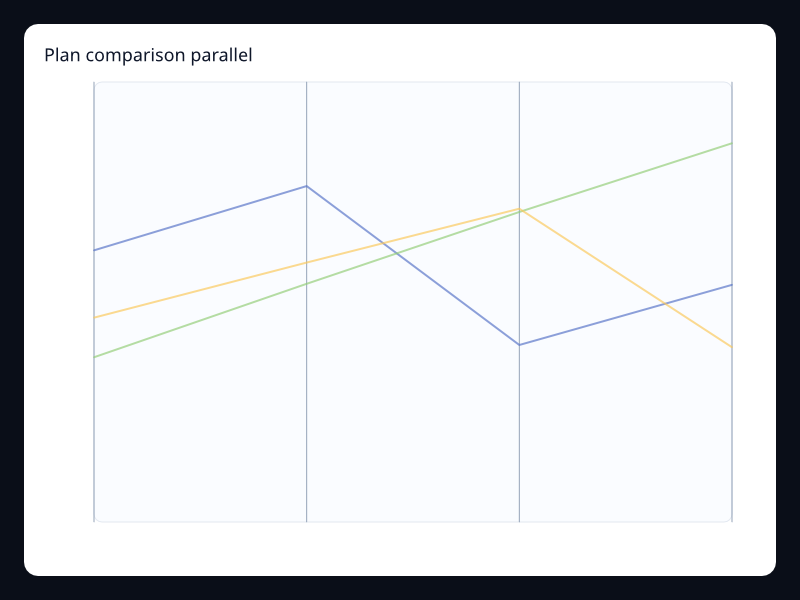
Plan comparison parallel uses Fission Charts typed Rust data to render a production-ready statistical view. Use it when tradeoffs across measures matter.
Data: Typed chart data, axes, and series.
Use when: Use it when tradeoffs across measures matter
Tags: parallel
Risk score parallel
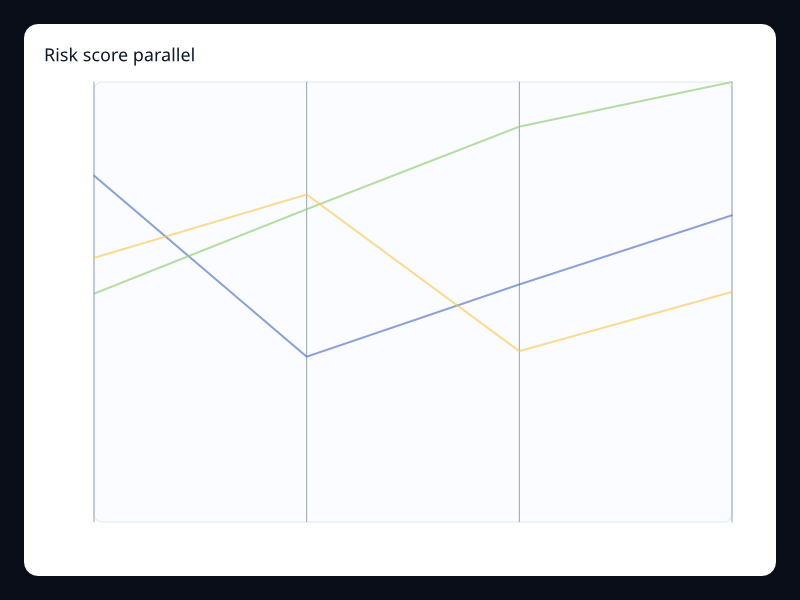
Risk score parallel uses Fission Charts typed Rust data to render a production-ready statistical view. Use it for multidimensional risk assessment.
Data: Typed chart data, axes, and series.
Use when: Use it for multidimensional risk assessment
Tags: parallel
Alert hotspot scatter
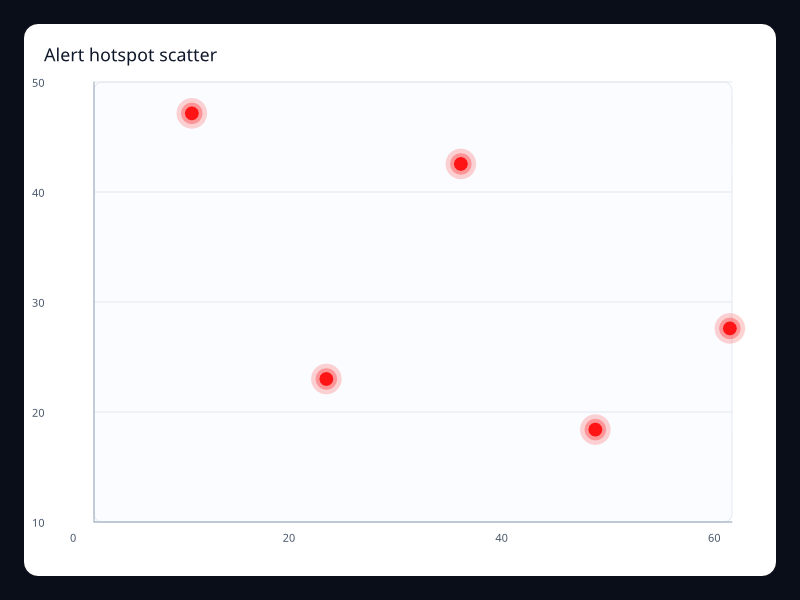
Alert hotspot scatter uses Fission Charts typed Rust data to render a production-ready statistical view. Use it when only important events should pulse visually.
Data: Typed chart data, axes, and series.
Use when: Use it when only important events should pulse visually
Tags: scatter
Efficiency frontier
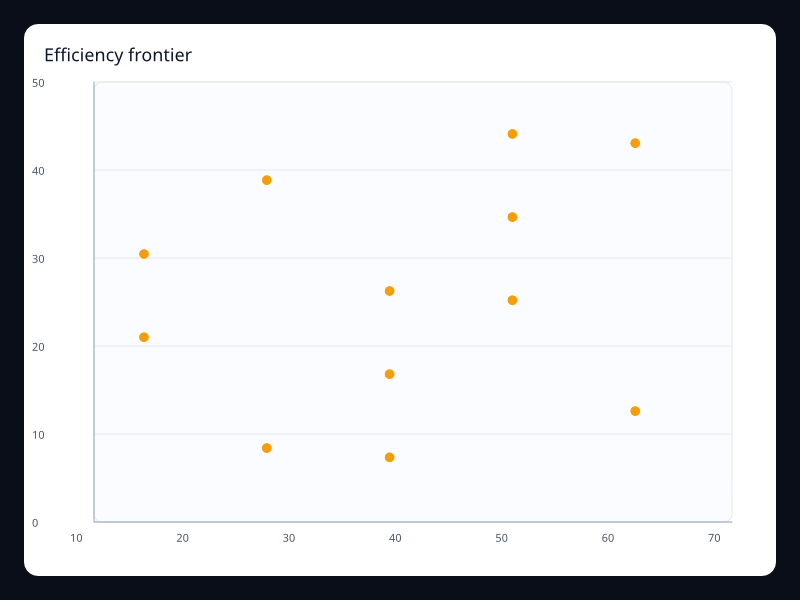
Efficiency frontier uses Fission Charts typed Rust data to render a production-ready statistical view. Use it to identify leading and lagging points.
Data: Typed chart data, axes, and series.
Use when: Use it to identify leading and lagging points
Tags: scatter
Lab sample scatter
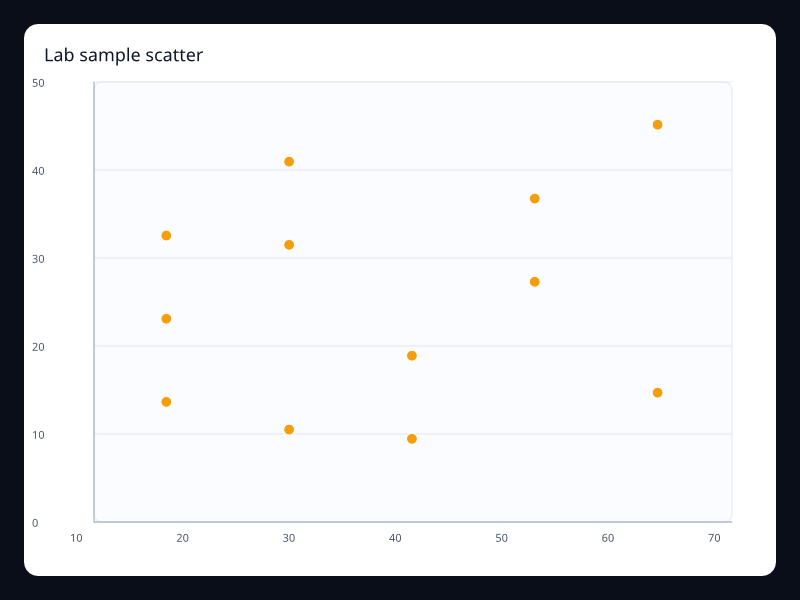
Lab sample scatter uses Fission Charts typed Rust data to render a production-ready statistical view. Use it for correlation and clustering questions.
Data: Typed chart data, axes, and series.
Use when: Use it for correlation and clustering questions
Tags: scatter
Portfolio risk return
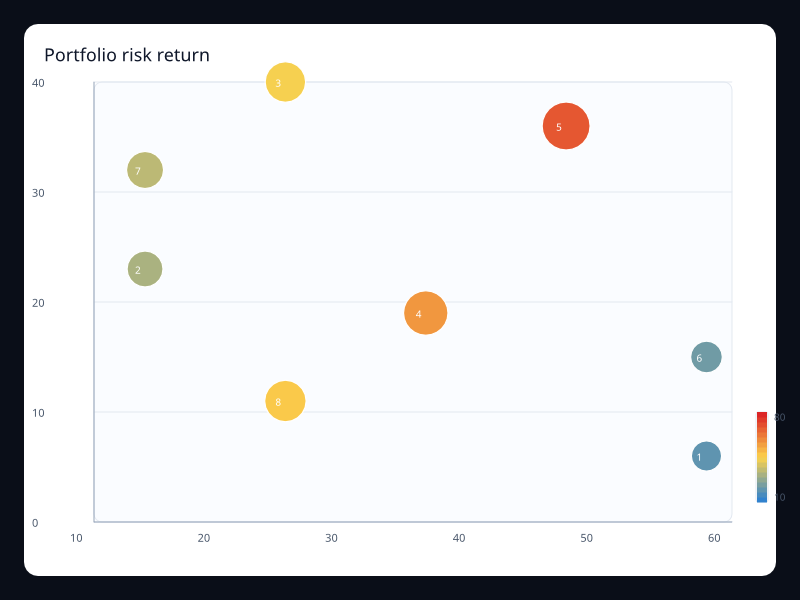
Portfolio risk return uses Fission Charts typed Rust data to render a production-ready statistical view. Use it to compare assets or initiatives with three measures.
Data: Typed chart data, axes, and series.
Use when: Use it to compare assets or initiatives with three measures
Tags: scatter
Quality outlier scatter
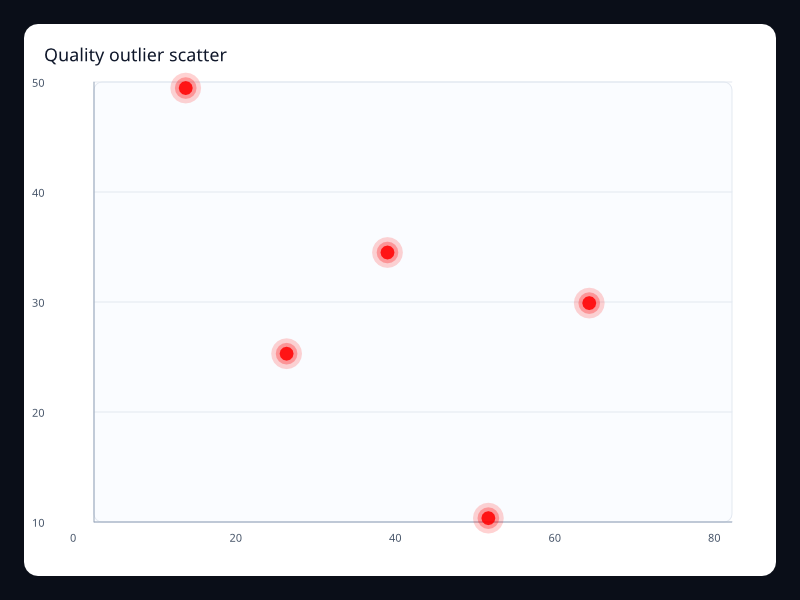
Quality outlier scatter uses Fission Charts typed Rust data to render a production-ready statistical view. Use it when outliers should attract attention immediately.
Data: Typed chart data, axes, and series.
Use when: Use it when outliers should attract attention immediately
Tags: scatter
Risk bubble matrix
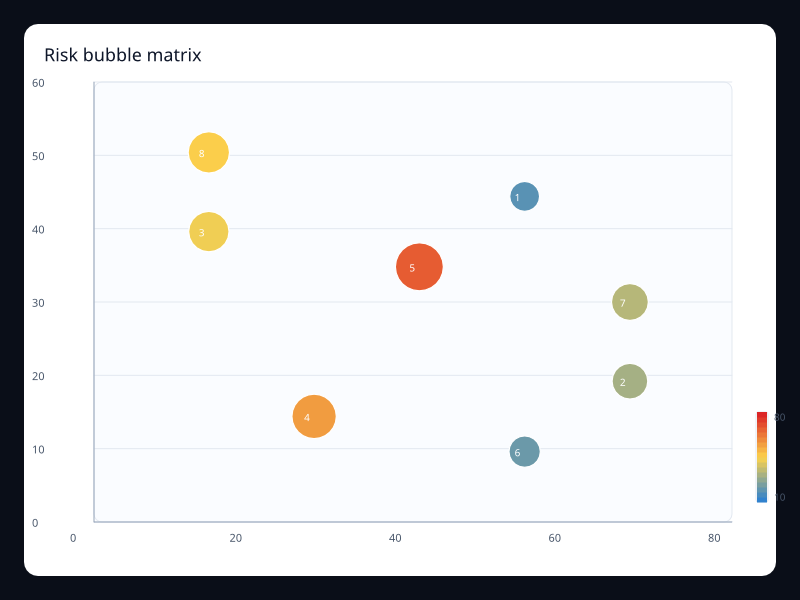
Risk bubble matrix uses Fission Charts typed Rust data to render a production-ready statistical view. Use it when size carries a third measure.
Data: Typed chart data, axes, and series.
Use when: Use it when size carries a third measure
Tags: scatter
Job runtime strip
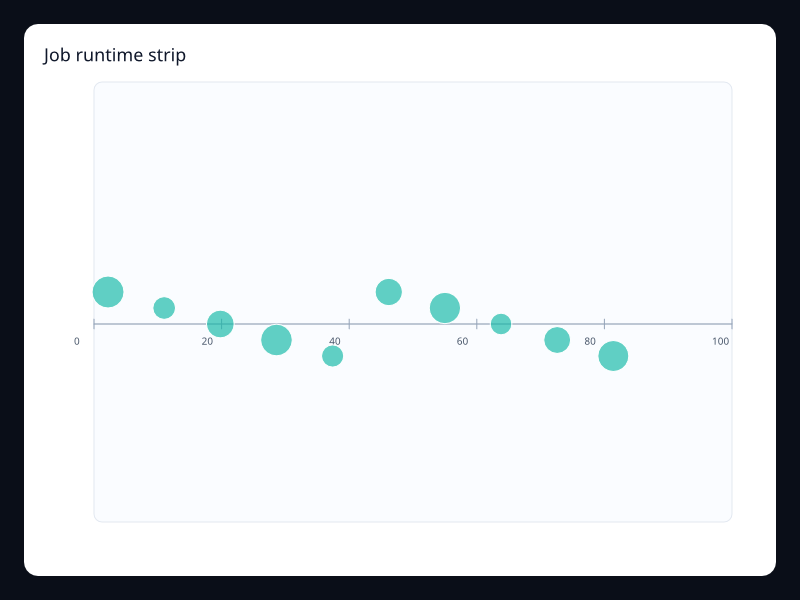
Job runtime strip uses Fission Charts typed Rust data to render a production-ready statistical view. Use it for queue and schedule views.
Data: Typed chart data, axes, and series.
Use when: Use it for queue and schedule views
Tags: singleAxis
Release event strip
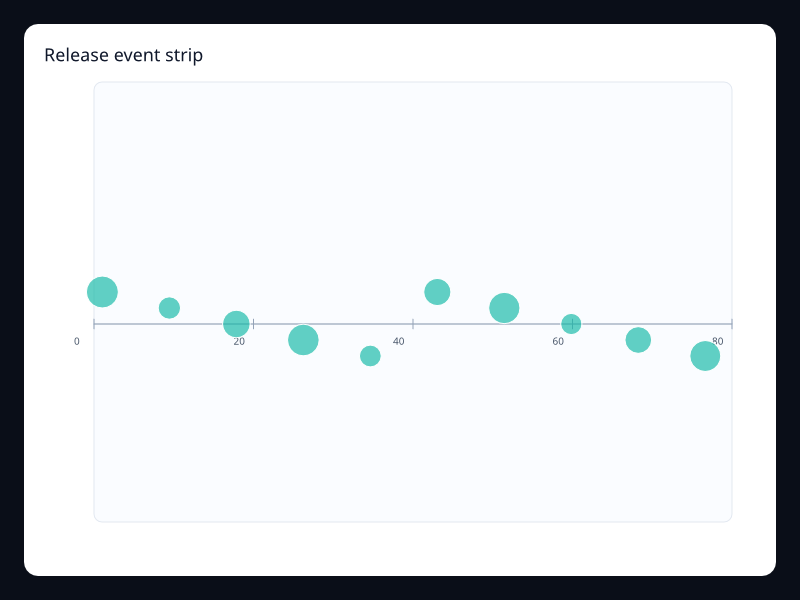
Release event strip uses Fission Charts typed Rust data to render a production-ready statistical view. Use it for compact event timelines.
Data: Typed chart data, axes, and series.
Use when: Use it for compact event timelines
Tags: singleAxis
Statistical And Finance
Boxplot
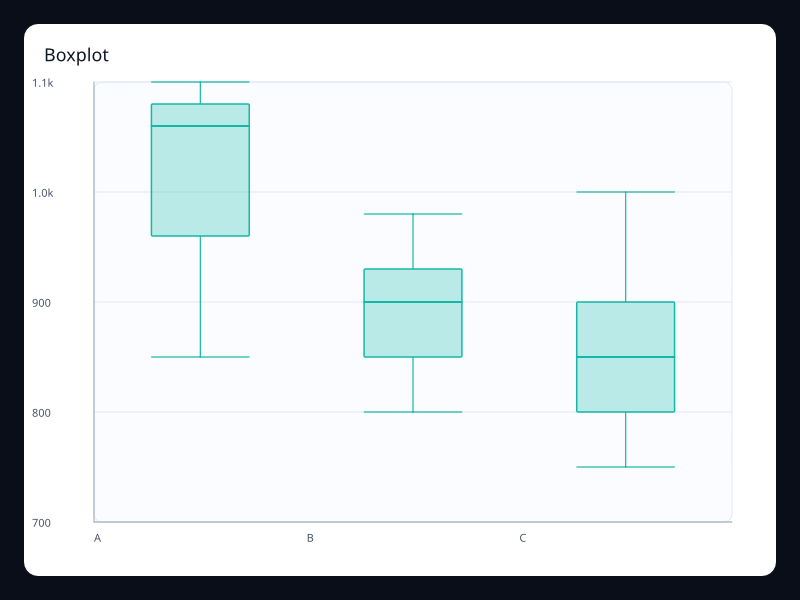
A distribution summary showing min, quartiles, median, and max. Use it when distribution matters more than a single average.
Data: Typed chart data, axes, and series.
Use when: Use it when distribution matters more than a single average
Tags: statistics
Candlestick
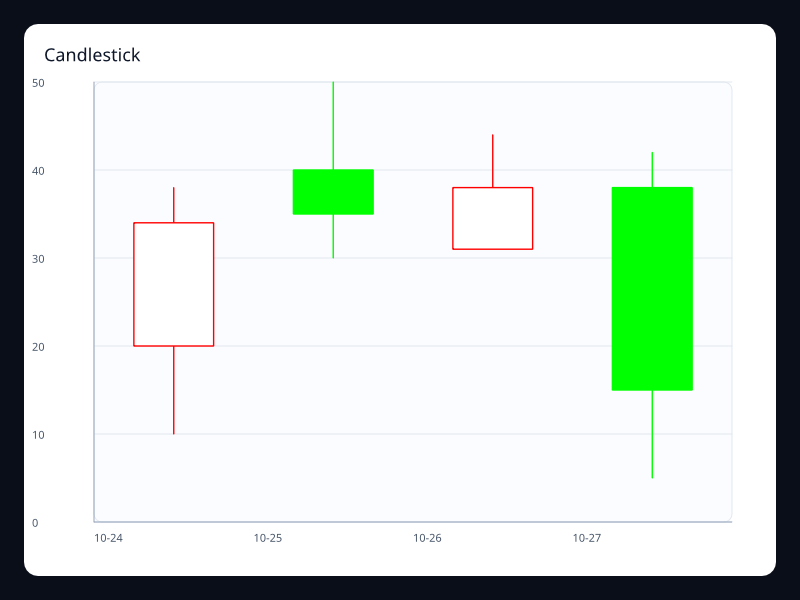
Open, close, low, and high values drawn as market candles. Use it for finance and other range-over-time data.
Data: Typed chart data, axes, and series.
Use when: Use it for finance and other range-over-time data
Tags: finance
Cartesian heatmap
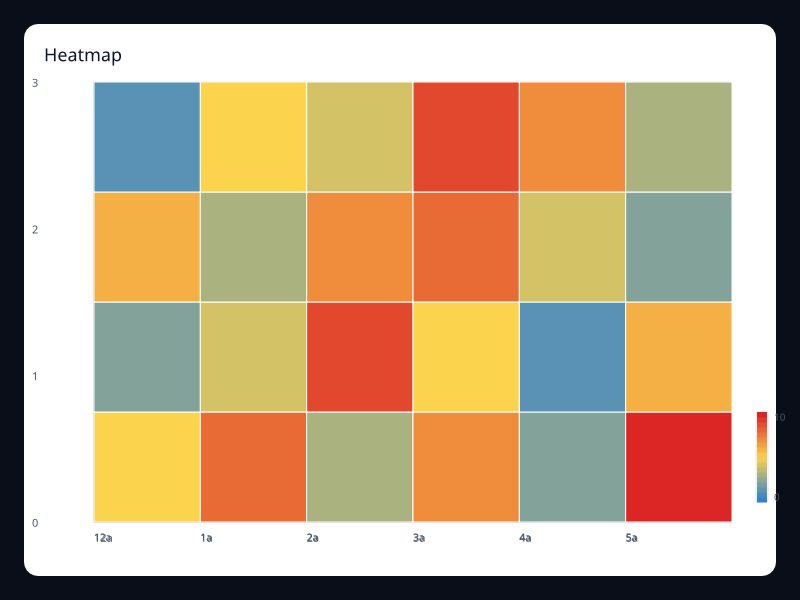
A rectangular value matrix rendered with a color scale. Use it for density, activity, and matrix-style comparison.
Data: Typed chart data, axes, and series.
Use when: Use it for density, activity, and matrix-style comparison
Tags: heatmap
Scatter
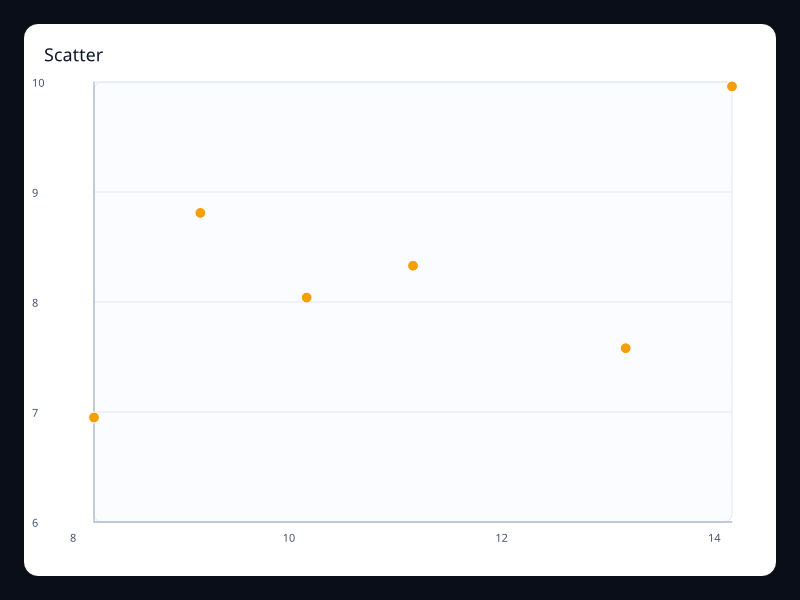
Points plotted by two numeric dimensions. Use it to find relationship, clustering, or outliers.
Data: Typed chart data, axes, and series.
Use when: Use it to find relationship, clustering, or outliers
Tags: scatter
Bubble scatter
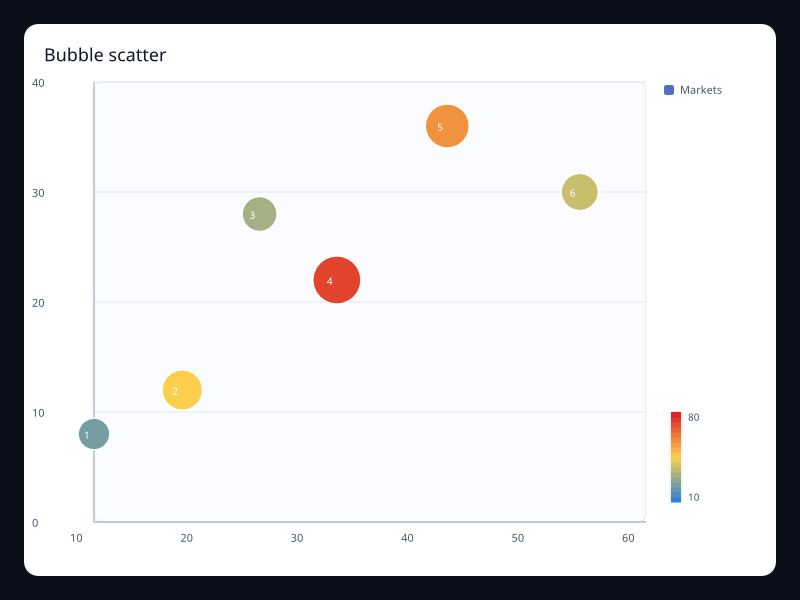
Scatter points where bubble size carries a third numeric dimension. Use it when two axes are not enough and size can encode importance or volume.
Data: Typed chart data, axes, and series.
Use when: Use it when two axes are not enough and size can encode importance or volume
Tags: scatter
Effect scatter
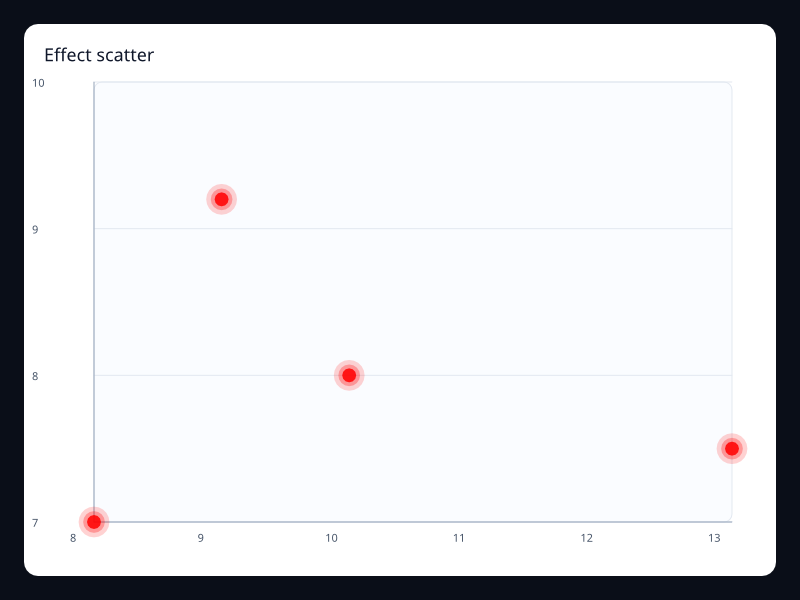
Scatter points with emphasis rings for important observations. Use it to mark active locations, alerts, or selected results.
Data: Typed chart data, axes, and series.
Use when: Use it to mark active locations, alerts, or selected results
Tags: scatter
After choosing a chart
Once you have a candidate chart, read Series and datasets to decide whether your data should be passed directly into series or shared through a dataset. Then read Data and interaction if the screen needs tooltips, brushing, zoom, event dispatch, or reducer-driven selection.
Lifecycle fit and verification
This page belongs to the setup, learn, build, test, and publish lifecycle. Use it to decide the next concrete action, then verify the action before moving to the next stage.
Stage question | Verification |
|---|---|
What file or command changes? | The page should point to the exact fission command, fission.toml section, Rust component, or generated artifact involved. |
What proves it worked? | Prefer a command output, generated file, screenshot, test assertion, package artifact, or deployed URL over a vague statement. |
What can fail safely? | Permission prompts, missing tools, unsupported hosts, invalid config, and expired credentials should produce diagnosable errors that can be retried after the cause is fixed. |
What should I read next? | Continue to the linked guide for step-by-step work or the reference page for exact fields and contracts. |
Previous
Charts overview
How to use the catalog
What each card tells you
3d And Gl
3D bar
3D capacity bars
3D grid bars
Globe
Globe coverage
Globe markers
3D graph
3D network
3D topology
3D line
3D spiral line
3D trajectory
Mesh surface
Dense point cloud
Sparse point cloud
Point cloud
3D scatter
3D scatter cluster
3D scatter outliers
3D capacity bars
3D grid bars
3D globe coverage
3D globe status
3D line path
3D spiral path
3D mesh field
3D network scene
3D operations bars
Dense 3D point cloud
Sparse 3D point cloud
3D cluster scatter
3D outlier scatter
3D service cloud
3D response surface
3D terrain response
3D wave surface
3D risk terrain
3D topology scene
3D volume points
3D surface
3D terrain mesh
3D wave surface
Terrain surface
Volume-style point field
Analytics
Acquisition trend
Engagement calendar
Channel stack
Cohort heatmap
Conversion funnel
Device mix donut
Analytics score gauge
Journey graph
Journey sankey
Market share pie
Segment parallel
Product radar
Region sales map
Retention area
Engagement routes
Segment bubbles
Source theme river
Portfolio sunburst
Report toolbox chart
Feature treemap
Bar
Benchmark comparison
Budget stack
Budget variance
Capacity bars
Channel stack
Compact category bars
Customer segment bars
Diverging bar
Funnel unit pictorial bars
Grouped quarterly bars
KPI background bars
Negative delta bars
Performance bands
Pictorial units
Priority queue bars
Product stack bars
Profit and loss bars
Quarter waterfall
Ranked bar
Region comparison bars
Region ranking
Retail waterfall
Return deltas
Rounded bar
Sales target track
SLA breach delta
Small multiple bars A
Small multiple bars B
Sorted horizontal bars
Stacked revenue bars
Store comparison
Team load bars
Ticket age distribution
Track progress bars
Utilization capacity
Waterfall bar
Weekday shape bars
Wide-label horizontal bars
Cartesian
Bar with background
Basic bar
Grouped bar
Horizontal bar
Positive and negative bar
Stacked bar
Area line
Basic line
Large line
Smooth line
Stacked area
Step line
Pictorial bar
Components And Interaction
Brush selection
Brush horizontal
Brush rectangle
Data zoom long
Data zoom short
Graphic band
Graphic callout
Mark area component
Mark line component
Mark point component
Timeline releases
Timeline years
Toolbox full
Toolbox zoom
Tooltip axis component
Tooltip item component
Visual map component
Data zoom
Graphic overlay
Mark line and point
Timeline
Toolbox actions
Axis tooltip
Coordinates
Calendar heatmap
Polar bar
Polar line
Single axis
Data Pipeline And Interaction
Encoded dataset
Visual map
Word cloud
Dataset
Calendar dataset activity
Filtered composition
Flow dataset sankey
Coverage dataset map
Quality dataset parallel
Product trend dataset
Products by year dataset
Ranked dataset bars
Risk bubbles dataset
Stacked revenue dataset
Dataset visual heatmap
Live alert scatter
Brush telemetry
Live activation funnel
Live bar update
Live line update
Live radar score
Live status gauge
Quarter timeline
Telemetry toolbox
Dataset And Dynamic
Encoded bars dataset
Encoded lines dataset
Dataset stacked area
Dynamic brush scatter
Dynamic alert scatter
Dynamic sales funnel
Dynamic score gauge
Dynamic speed gauge
Dynamic pictorial units
Dynamic polar score
Dynamic radar health
Dynamic single-axis events
Dynamic toolbox line
Visual map calendar
Visual map heatmap
Visual map scatter
Geo
Data center links
Dispatch routes
Migration flow
Network overlay
Route overlay map
Sales route map
Courier routes
Flight density lines
Incident routing lines
Network traffic lines
Supply routes
Capacity regions map
Coverage score map
Expansion plan map
Incident severity map
Market regions map
Risk regions map
Sales territory map
Service health map
Support demand map
Geo And Route
Migration routes
Geo network
Route arcs
Route map overlay
Flight-like lines
Traffic lines
Region value map
Risk map
Sales map
Service coverage map
Geographic And Route
Geo lines
Lines
Choropleth map
Route map
Heatmap
Commit activity calendar
Incident volume calendar
Quality gates calendar
Release burndown calendar
Daily retention calendar
Daily sales calendar
User activity calendar
Access matrix
Availability window
Correlation grid
Deployment hour heatmap
Feature usage heatmap
Queue depth matrix
Regression risk matrix
Resource saturation
Service risk matrix
Support load heatmap
Visual map build calendar
Density visual map
Load grid visual map
Heatmap And Calendar
Build calendar
Incident calendar
Quarter calendar heatmap
Retention calendar
Availability heatmap
Correlation heatmap
Large matrix heatmap
Resource load heatmap
Risk grid heatmap
Small matrix heatmap
Weekday hour heatmap
Visual map density
Hierarchy
Alert correlation graph
Customer journey graph
Platform topology graph
Service dependencies
Energy balance sankey
Lead flow sankey
Resolution path sankey
Customer segment sunburst
Feature area sunburst
Org revenue sunburst
Channel mix river
Support theme river
File ownership tree
Platform module tree
Product taxonomy tree
Radial service tree
Budget allocation treemap
Cost center treemap
Storage class treemap
Hierarchy And Flow
Circular-like graph
Dependency graph
Service graph
Energy sankey
User-flow sankey
Product sunburst
Revenue sunburst
Demand theme river
Traffic theme river
File-system tree
Org tree
Radial taxonomy
Budget treemap
Storage treemap
Interaction
Annotation callout
Brush outliers
Brush region
Data zoom overview
Telemetry zoom
Graphic band
Graphic note
Breach mark area
Deployment marks
Marked SLO chart
Selectable scatter
Capacity timeline
Timeline releases
Timeline years
Analysis toolbox
Export toolbox
Restore toolbox
Axis tooltip
Grouped tooltip
Item tooltip
Line
Alert annotations
Line with alert events
Annotated line
API throughput line
Capacity forecast band
Conversion stack area
Demand sparkline
Deployment event line
Dual line comparison
Error budget burn
Forecast band
Gradient area line
Inventory end-step
Log-shaped line
Market index line
Min/max band
Operational step series
Product mix area
Quality operating band
Regional trend comparison
Release window annotation
Retention zoom window
Revenue seasonality
Rolling average line
Seasonal line
Service latency trend
Signup cohort comparison
Dense spark line
Stacked stream area
Step end line
Step start line
Support volume area
Line with threshold
Traffic rolling average
Weekly cycle line
Zoomed line window
Monitoring
Monitoring 3D cloud
Monitoring 3D grid
Monitoring annotation
Brush investigation
Capacity gauge
Dependency graph
Monitoring error band
Error scatter
Operational flow sankey
Load heatmap
Monitoring overview line
Operational region map
Release timeline
Monitoring risk radar
Operational route lines
Service rank
Monitoring event strip
Monitoring toolbox
Monitoring traffic bars
Uptime calendar
Pie And Radial
Capacity gauge
Score gauge
Area rose
Device mix donut
Market share pie
Nested-style donut
Presentation rose
Two-level donut
Cyclic polar bars
Wind polar line
Radar profile A
Radar profile B
Radial
Availability gauge
Build confidence gauge
Capacity headroom gauge
Deploy health gauge
Device donut
Expense donut
Exposure area rose
Market rose
Plan share pie
Revenue mix donut
Risk rose
Source mix pie
Cycle polar line
Hourly load polar bars
Seasonality polar bars
Wind speed polar line
Platform readiness radar
Product fit radar
Service health radar
Team balance radar
Radial And Polar
Gauge
Progress gauge
Liquid fill
Pie
Donut
Rose by area
Rose by radius
Radar
Filled radar
Relationships And Hierarchy
Funnel
Force graph
Parallel coordinates
Sankey
Sunburst
Theme river
Tree
Radial tree
Treemap
Scatter And Statistical
Latency boxplot
Quality boxplot
Intraday candlestick
Candlestick with movement
Conversion funnel
Recruiting funnel
Product parallel coordinates
Quality parallel coordinates
Market bubble chart
Scatter clusters
Scatter outliers
Risk return scatter
Distribution single axis
Event single axis
Statistical
API latency boxplot
Quality spread boxplot
Region spread boxplot
Customer value bubbles
Crypto session candlestick
Equity session candlestick
Volume shift candlestick
Activation funnel
Support resolution funnel
Device quality parallel
Plan comparison parallel
Risk score parallel
Alert hotspot scatter
Efficiency frontier
Lab sample scatter
Portfolio risk return
Quality outlier scatter
Risk bubble matrix
Job runtime strip
Release event strip
Statistical And Finance
Boxplot
Candlestick
Cartesian heatmap
Scatter
Bubble scatter
Effect scatter
After choosing a chart
Lifecycle fit and verification