
Relationships and hierarchy
The Relationships and hierarchy family contains 9 renderer-backed chart variants. Use this page as the entry point for choosing the right variant, then open the variant page for the screenshot, data shape, Rust API notes, and example code.
The chart family is still ordinary Fission UI. Each variant is constructed from typed Rust data, participates in layout and theme decisions, and can be driven by app state, reducers, resources, jobs, or services just like any other widget.
Variants
Chart | Data shape | Use when |
|---|---|---|
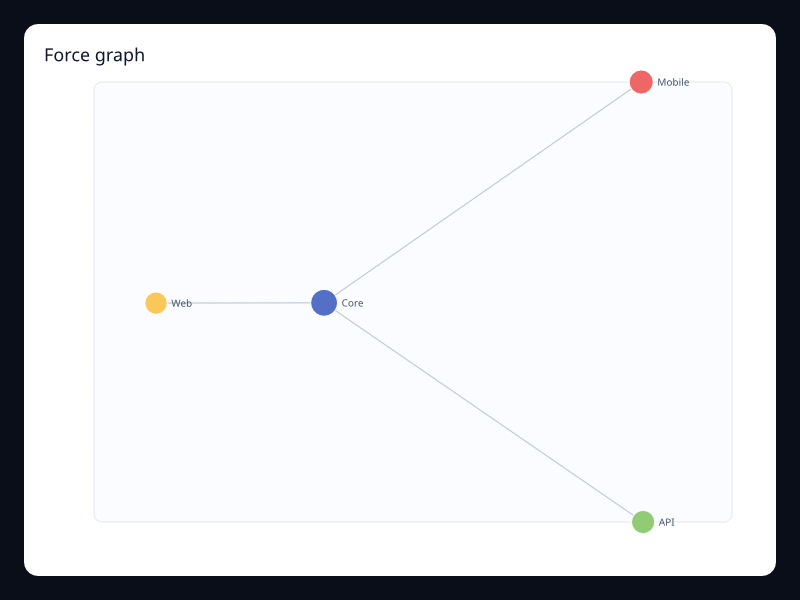
Vertex list plus edge list. | Use it for dependency, social, and topology diagrams. | |
Ordered label/value pairs. | Use it for conversion stages and pipeline health. | |
Vec<Vec<f32>> with one row per observation. | Use it for high-dimensional filtering and comparison. | |
Nested nodes with optional values. | Use it when the hierarchy is shallow and symmetry matters more than linear reading. | |
Vertex list plus weighted edges. | Use it for energy, revenue, and conversion flows. | |
Nested nodes with values. | Use it when hierarchy depth should remain visible. | |
Time, value, and category tuples. | Use it when composition changes continuously over time. | |
Nested nodes with optional values. | Use it for navigation structures, ownership trees, and dependency drilldown. | |
Nested nodes with values. | Use it for storage, budgets, or part-to-whole hierarchy. |
Choosing within this family
Start with the user's question, not the visual effect. Pick the simplest variant that makes the answer clear, add interaction only when it reduces work for the user, and keep animation purposeful enough that it explains a change rather than decorating the page.
Authoring from a Fission component
Use this reference page as the chart expression inside ordinary Fission component conversion. The chart is a Widget, so it can sit inside a Card, Grid, Scroll, responsive page section, or any other layout container.
use fission::prelude::*;
use fission::charts::{Axis, Chart, LineSeries};

pub struct RelationshipsAndHierarchyChart;

impl From<RelationshipsAndHierarchyChart> for Widget {
    fn from(_: RelationshipsAndHierarchyChart) -> Widget {
        Chart::new()
            .title("Relationships and hierarchy")
            .x_axis(Axis::category(vec!["A", "B", "C"]))
            .y_axis(Axis::value())
            .series(vec![LineSeries::new("Series").data(vec![1.0, 2.0, 3.0]).into()])
            .into()
    }
}
Keep expensive data loading outside component conversion. A reducer, job, service, or server route should prepare the typed chart data, then the component should read that state and construct the chart deterministically.
Options, accessibility, and diagnostics
Area | What to decide | How to verify |
|---|---|---|
Data shape | Keep source rows in typed Rust structs, then map them into the series type shown in the example. | Unit test the mapping separately from rendering. |
Options | Choose axes, legends, labels, animation, and interaction based on the user's task. | Add a screenshot test when changing visual behavior. |
Accessibility | Provide a clear title and adjacent summary text for important trends or outliers. | Inspect the generated semantics and make sure the chart is understandable without color alone. |
Failure handling | Render an empty, loading, or error state before constructing the chart if data is unavailable. | Test empty data, partial data, and failed fetches. |
Performance | Prefer summarized or windowed data for very large datasets; keep full raw history in the data layer. | Profile frame time and interaction latency with representative data volumes. |
Previous
Rose by radius
Next
Force graph