
3D and GL
The 3D and GL family contains 44 renderer-backed chart variants. Use this page as the entry point for choosing the right variant, then open the variant page for the screenshot, data shape, Rust API notes, and example code.
The chart family is still ordinary Fission UI. Each variant is constructed from typed Rust data, participates in layout and theme decisions, and can be driven by app state, reducers, resources, jobs, or services just like any other widget.
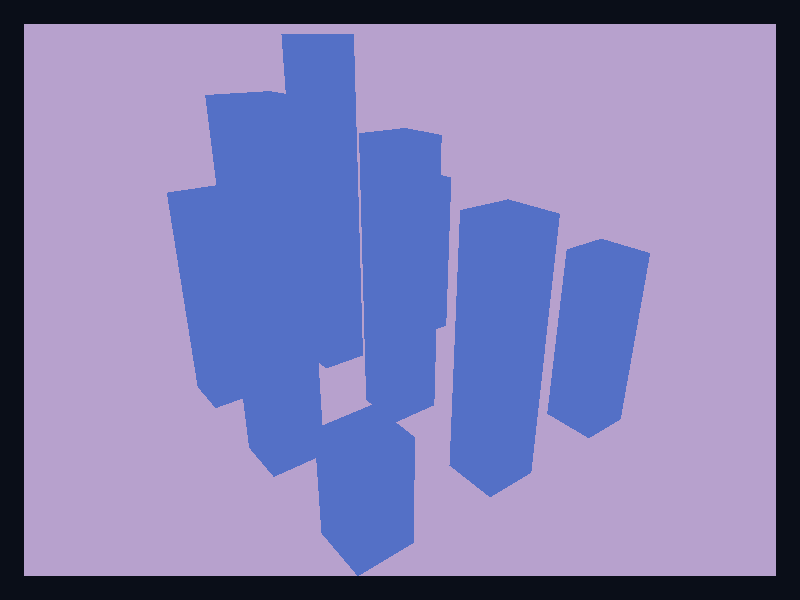
Variants
Chart | Data shape | Use when |
|---|---|---|
A grid of values lowered into Scene3D mesh cuboids. | Use it when depth and spatial grouping are part of the story, not as a default bar replacement. | |
Scene3D mesh cuboids. | Use it for spatial capacity displays. | |
Scene3D cuboids representing numeric height. | Use it when depth is part of the visual story. | |
Spheres positioned in 3D space. | Use it for spatial point clusters. | |
Globe primitive with highlighted locations. | Use it for coverage and status over a globe. | |
Globe sphere with visible markers. | Use it when global context matters. | |
Vertex positions and values lowered into Scene3D primitives. | Use it when topology benefits from depth or when the graph is part of a 3D product surface. | |
Scene3D mesh cuboids. | Use it when depth and grouping are part of the data. | |
Grid of cuboids in a native 3D scene. | Use it for spatial bar comparisons. | |
Ordered 3D positions lowered into Scene3D primitives. | Use it for paths, movement, and ordered spatial traces. | |
Spheres and segment meshes forming a path. | Use it for trajectories and movement. | |
Mesh surface primitive. | Use it for custom mesh data. | |
Scene3D nodes and segment meshes. | Use it for topology in depth. | |
Vertex spheres connected by segment meshes. | Use it for spatial network views. | |
3D bars over an operational grid. | Use it when spatial placement helps compare operational metrics. | |
3D points with varied position and radius. | Use it to show outliers in a point cloud. | |
Mesh vertices and indices forming a surface. | Use it for continuous spatial fields. | |
Terrain surface using native mesh rendering. | Use it for risk and elevation-like surfaces. | |
Vec<(x, y, z, radius)> lowered into Scene3D spheres. | Use it when all three dimensions are meaningful and the app benefits from spatial inspection. | |
Scene3D spheres. | Use it for spatial sample clusters. | |
Scene3D spheres. | Use it for spatial outlier inspection. | |
Service points in 3D space. | Use it to visualize clusters of service observations. | |
Scene3D mesh segments plus points. | Use it for ordered spatial signals. | |
Line path through depth. | Use it for trajectory demos and spatial flows. | |
Mesh vertices and triangle indices generated from sampled z values. | Use it for terrain, response surfaces, and continuous two-variable functions. | |
Scene3D mesh vertices and indices. | Use it for elevation and terrain fields. | |
Raised terrain-like mesh. | Use it for elevation and field surfaces. | |
Scene3D nodes and segment meshes. | Use it for spatial relationship maps. | |
3D graph nodes and links. | Use it when topology benefits from depth. | |
Scene3D mesh segments plus spheres. | Use it for movement paths. | |
Point field suggesting volume data. | Use it as the native point-based volume path. | |
Scene3D mesh vertices and indices. | Use it for sampled surfaces. | |
Surface mesh with wave-like height variation. | Use it for continuous response fields. | |
Many small spheres in 3D space. | Use it for point fields and early volume-style views. | |
Scene3D spheres. | Use it for scan-like data. | |
Scene3D sphere primitives plus marker primitives. | Use it when global shape and spatial orientation matter to the reader. | |
Scene3D spheres. | Use it for global product views. | |
Scene3D spheres. | Use it for global context. | |
Scene3D mesh primitive. | Use it for custom mesh data. | |
A collection of x, y, z positions with point radii. | Use it for spatial samples, scan data, and dense 3D observations. | |
Sparse spatial points. | Use it when individual 3D observations need separation. | |
Scene3D spheres. | Use it for sampled spatial observations. | |
Grid-generated mesh vertices and triangle indices. | Use it for terrain, elevation, and other continuous spatial fields. | |
Scene3D spheres. | Use it as the current native path toward volume-style visualization. |
Choosing within this family
Start with the user's question, not the visual effect. Pick the simplest variant that makes the answer clear, add interaction only when it reduces work for the user, and keep animation purposeful enough that it explains a change rather than decorating the page.
Authoring from a Fission component
Use this reference page as the chart expression inside ordinary Fission component conversion. The chart is a Widget, so it can sit inside a Card, Grid, Scroll, responsive page section, or any other layout container.
use fission::prelude::*;
use fission::charts::{Axis, Chart, LineSeries};

pub struct Fission3DAndGLChart;

impl From<Fission3DAndGLChart> for Widget {
    fn from(_: Fission3DAndGLChart) -> Widget {
        Chart::new()
            .title("3D and GL")
            .x_axis(Axis::category(vec!["A", "B", "C"]))
            .y_axis(Axis::value())
            .series(vec![LineSeries::new("Series").data(vec![1.0, 2.0, 3.0]).into()])
            .into()
    }
}
Keep expensive data loading outside component conversion. A reducer, job, service, or server route should prepare the typed chart data, then the component should read that state and construct the chart deterministically.
Options, accessibility, and diagnostics
Area | What to decide | How to verify |
|---|---|---|
Data shape | Keep source rows in typed Rust structs, then map them into the series type shown in the example. | Unit test the mapping separately from rendering. |
Options | Choose axes, legends, labels, animation, and interaction based on the user's task. | Add a screenshot test when changing visual behavior. |
Accessibility | Provide a clear title and adjacent summary text for important trends or outliers. | Inspect the generated semantics and make sure the chart is understandable without color alone. |
Failure handling | Render an empty, loading, or error state before constructing the chart if data is unavailable. | Test empty data, partial data, and failed fetches. |
Performance | Prefer summarized or windowed data for very large datasets; keep full raw history in the data layer. | Profile frame time and interaction latency with representative data volumes. |