
Nested-style donut
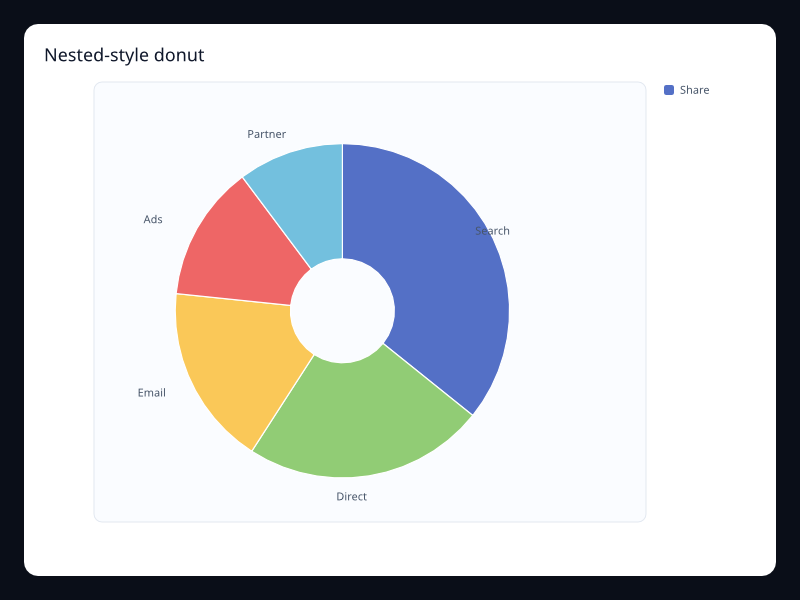
A donut can leave room for a separate status or total, but the empty centre does not create another level of data. This example remains one flat part-to-whole breakdown. The screenshot is from Fission's chart gallery.
What the chart is for
Use it for mutually exclusive storage classes within one account, such as documents, images and archived exports. If those classes have meaningful children, preserve the hierarchy in a Sunburst or treemap rather than calling a flat donut nested.
Data model
PieSeries stores label/value pairs, not parent/child records. inner_radius changes the hole in logical pixels; it does not create nested rings, a centre label or an automatic total. Supply finite non-negative values in one unit and reporting snapshot.
Authoring from a Fission component
The parent supplies storage totals in GiB and resolved display labels. Keep byte-accurate values in the data model and use this floating-point projection only for presentation.
use fission::prelude::*;
use fission::charts::{Chart, PieSeries};

// The parent resolves display labels from its translation bundles.
fission_component! {
    pub AccountStorageClasses<()> {
        props {
            chart_title: String,
            series_label: String,
            size_gib_by_class: Vec<(String, f32)>,
        }
    }
    view(report, _state, _cx) {
        let values = report.size_gib_by_class.iter()
            .map(|(label, value)| (label.as_str(), *value))
            .collect();
    } => Chart(
        title: Some(report.chart_title.clone()),
        series: vec![PieSeries::new(&report.series_label)
            .data(values)
            .inner_radius(48.0)
            .into()],
    )
}
Testing and accessibility
Check zero-sized classes, unavailable storage measurements and a single dominant class. Provide exact values and the total alongside the chart. Inspect the largest expected labels at mobile widths; adding categories to a donut is not a substitute for a readable detailed report.
Tags: pie, nested.
Previous
Market share pie