
Service latency trend
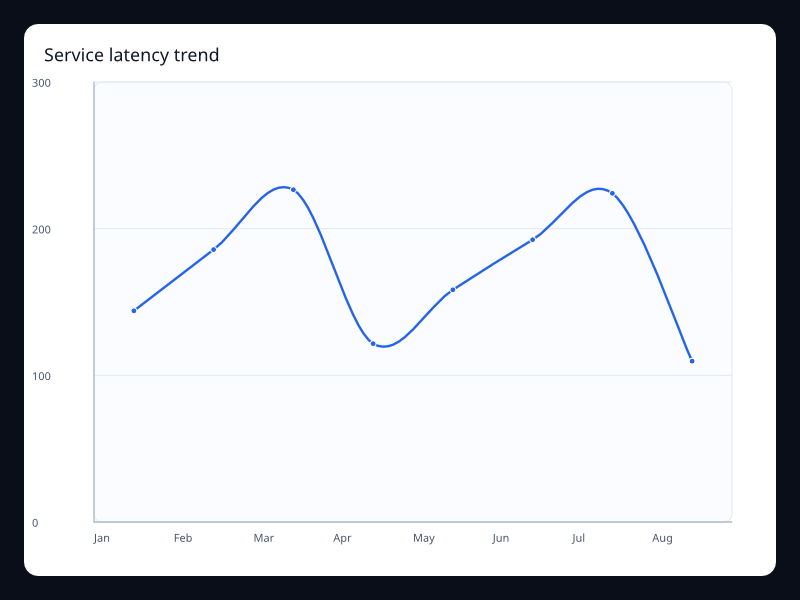
A latency trend helps an operator see when a service slowed down and whether it recovered. The measure needs to be named: an average, a maximum and a 95th percentile can describe very different experiences. The screenshot is from Fission's chart gallery.
What the chart is for
This example shows the p95 response time for each minute. The chart does not calculate percentiles, and an average of per-minute percentiles is not the percentile of the combined requests.
Data model
Calculate each minute's p95 from the intended request population before rendering, then supply matching labels and millisecond values. A minute without requests has no response-time percentile and needs a deliberate no-data treatment.
Authoring from a Fission component
Prepare the source aggregate before building the chart. The component receives labels and values as props, with no asynchronous work hidden in the view.
use fission::prelude::*;
use fission::charts::{Axis, Chart, LineSeries};

// The parent resolves display labels from its translation bundles.
fission_component! {
    pub ServiceLatencyTrendChart<()> {
        props {
            chart_title: String,
            series_label: String,
            labels: Vec<String>,
            p95_ms: Vec<f32>,
        }
    }
    view(report, _state, _cx) {
        let labels = report.labels.iter().map(String::as_str).collect();
    } =>
        Chart(
            title: Some(report.chart_title.clone()),
            x_axis: Some(Axis::category(labels)),
            y_axis: Some(Axis::value()),
            series: vec![
                LineSeries::new(&report.series_label)
                    .data(report.p95_ms.clone())
                    .into(),
            ],
        )
}
Testing and accessibility
Check a brief spike, no-request intervals and changes in the request filter. Keep the current percentile and reporting window in text, and preserve spikes when choosing how much history to display.
Tags: line, latency.
Previous
Seasonal line