
Availability heatmap
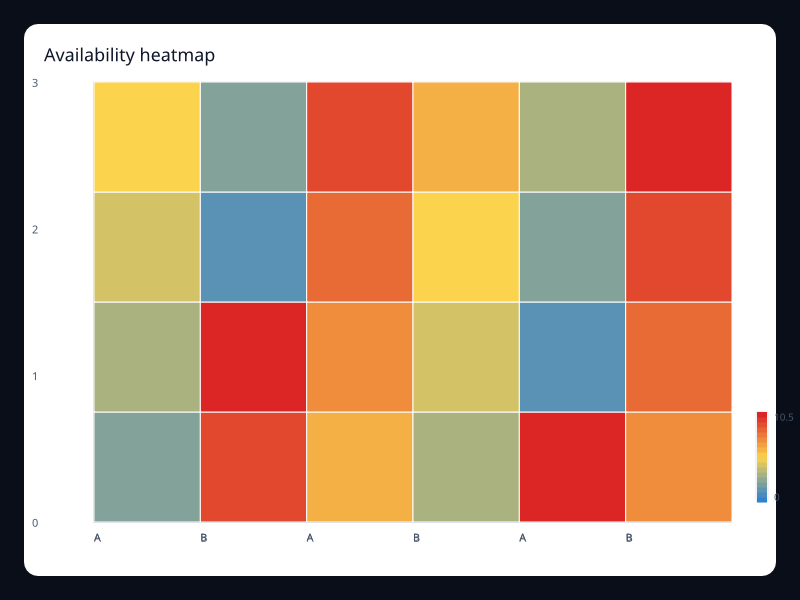
An availability heatmap compares the same measure across services and reporting windows. A missing observation is not a failed service, and a confirmed 0% result is not missing data.
use fission::prelude::*;
use fission::charts::{Axis, Chart, HeatmapSeries, Series, VisualMap};

#[derive(Clone)]
pub struct MetricCell {
    pub column: usize,
    pub row: usize,
    pub value: f32,
}

fission_component! {
    pub MetricMatrix<()> {
        props {
            title: String,
            measure_label: String,
            explanation: TextContent,
            columns: Vec<String>,
            rows: Vec<String>,
            cells: Vec<MetricCell>,
            colour_scale: VisualMap,
        }
    }
    view(report, _state, _cx) => Column(children: [
        Text(report.explanation.clone()),
        Chart(
            title: Some(report.title.clone()),
            x_axis: Some(Axis::category(report.columns.iter().map(String::as_str).collect())),
            y_axis: Some(Axis::category(report.rows.iter().map(String::as_str).collect())),
            visual_map: Some(report.colour_scale.clone()),
            series: vec![Series::Heatmap(HeatmapSeries::new(&report.measure_label)
                .data(report.cells.iter().map(|cell|
                    (cell.column, cell.row, cell.value)
                ).collect()))],
        ),
    ])
}
Put this in widgets/metric_matrix.rs. For availability, each value is 100 * successful_probes / attempted_probes with a positive denominator and consistent probe definition. Omit unobserved cells deliberately and explain their absence. Supply translated service/window captions, title and summary, with a fixed 0–100 scale.
Validate cell bounds, unique row/column pairs and finite percentages before rendering. Unlike a calendar's missing-day behavior, sparse heatmap cells are not drawn. Retain exact successful/attempted counts because a percentage based on one probe is not equivalent evidence to one based on thousands.
Test no probes, failed probes, delayed telemetry and window boundaries. Use a colour-blind-readable scale plus an exact-value view. The gallery screenshot is a separate fixture.
Previous
Heatmap and calendar
Next
Build calendar