
Dataset stacked area
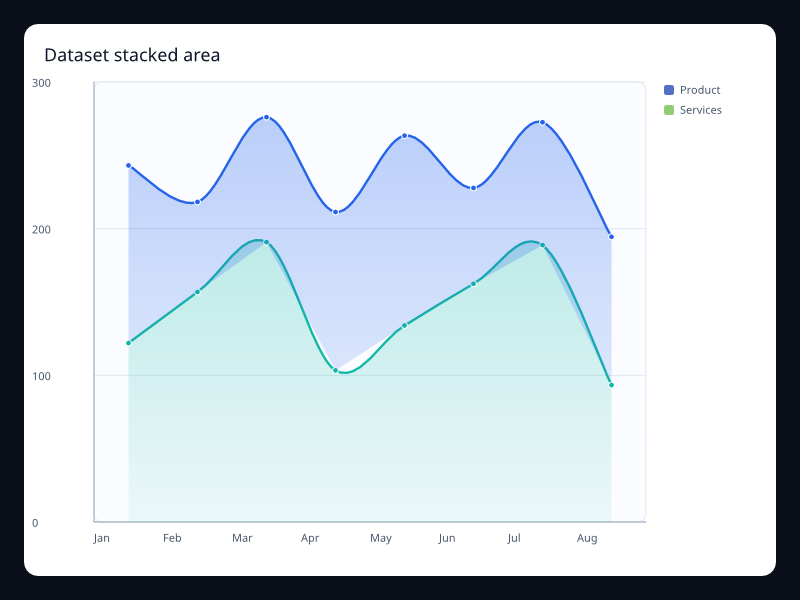
A dataset-backed stack still needs additive measures. Interactive and scheduled jobs can form a total if each job has one source; arrivals and completions cannot be treated as independent contributions to the same total.
use fission::prelude::*;
use fission::core::op::Color;
use fission::charts::{
    Axis, Chart, DataValue, Dataset, Encode, Legend, LineSeries, Series,
};

#[derive(Clone)]
pub struct WorkSourcePeriod {
    pub label: String,
    pub interactive: u32,
    pub scheduled: u32,
}

fission_component! {
    pub EncodedWorkloadArea<()> {
        props {
            title: String,
            interactive_label: String,
            scheduled_label: String,
            interactive_colour: Color,
            scheduled_colour: Color,
            periods: Vec<WorkSourcePeriod>,
        }
    }
    view(workload, _state, _cx) {
        let dataset = Dataset::new()
            .dimensions(vec!["period".into(), "interactive".into(), "scheduled".into()])
            .source(workload.periods.iter().map(|row| vec![
                DataValue::String(row.label.clone()),
                DataValue::Number(row.interactive as f32),
                DataValue::Number(row.scheduled as f32),
            ]).collect());
    } => Chart(
        title: Some(workload.title.clone()),
        dataset: Some(dataset),
        x_axis: Some(Axis::category(Vec::new())),
        y_axis: Some(Axis::value().min(0.0)),
        legend: Some(Legend::top_right()),
        series: vec![
            Series::Line(LineSeries::new(&workload.interactive_label)
                .encode(Encode::new().x("period").y("interactive"))
                .stack("work-source").area_style(workload.interactive_colour)),
            Series::Line(LineSeries::new(&workload.scheduled_label)
                .encode(Encode::new().x("period").y("scheduled"))
                .stack("work-source").area_style(workload.scheduled_colour)),
        ],
    )
}
The shared key adds encoded values, while fills use parent-supplied design colours. Supply translated labels and complete equal-length intervals. Keep the dataset a projection rather than a second editable store.
Test schema keys, category order and reconciliation against the independently calculated total. Do not allow missing values to become zero without an explicit data rule. Show counts outside the plot and use grouped bars when precise upper-contribution comparisons matter. The image is a gallery fixture.
Previous
Dataset and dynamic