
Polar line
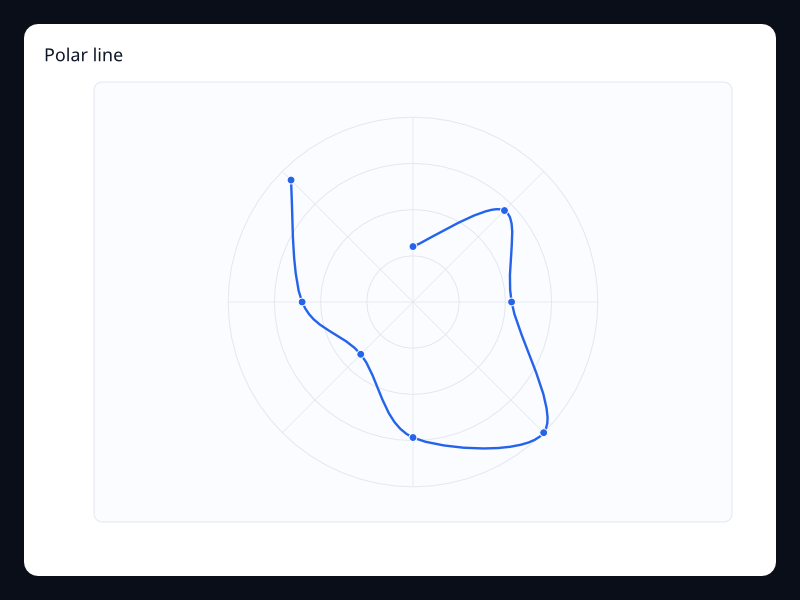
A line series mapped by angle and radius. Use it for wind, direction, periodic signals, and angular measurements. The screenshot is captured from the native Fission chart gallery.
What the chart is for
Polar line is part of the Coordinates chart family and is intended for Vec<(angle_degrees, radius)>. Use it when the visual form makes the user's question faster to answer than a table or a simpler chart would.
Avoid it when readers need exact linear comparison; coordinate charts work best when the coordinate system carries meaning.
Data model
Vec<(angle_degrees, radius)>. Keep the data close to the type that describes it. Fission Charts is typed Rust, so a line uses LineSeries, a calendar heatmap uses CalendarHeatmapSeries, and chart components such as zoom, marks, and graphics are explicit fields on Chart rather than hidden string configuration.
Rust API
Field | Type | Notes |
|---|---|---|
title | &str | Names the chart for the screen, accessibility tree, and test output. |
series | PolarBarSeries / PolarLineSeries | Stores radial label/value bars or angle/radius line samples. |
width / height | f32 | Optional fixed size; omit them when the chart should flex inside Fission layout. |
Example
use fission::charts::{Chart, PolarLineSeries};

let chart = Chart::new()
    .title("Polar line")
    .series(vec![PolarLineSeries::new("Wind")
        .data(vec![(0.0, 18.0), (45.0, 42.0), (90.0, 32.0), (135.0, 60.0)])
        .smooth(true)
        .into()]);
Interaction and animation
Charts can emit typed ChartInteractionEvent values when interaction is enabled. Handle those events in a reducer when the app needs hover, press, release, scroll, selection, or brush behavior. ChartAnimation stores duration, delay, stagger, easing, and reduced-motion behavior as deterministic chart data, so animation timing can be tested instead of being hidden in ad-hoc timers.
Testing guidance
For this chart, test the data mapping first, then test lowering, then capture a live screenshot when visual output changes. The screenshot for this page is refreshed by running the ignored chart-gallery screenshot capture test with FISSION_UPDATE_CHART_DOCS=1, which updates documentation/static/img/charts before the static site build.
Authoring from a Fission component
Use this reference page as the chart expression inside ordinary Fission component conversion. The chart is a Widget, so it can sit inside a Card, Grid, Scroll, responsive page section, or any other layout container.
use fission::prelude::*;
use fission::charts::{Chart, PolarLineSeries};

pub struct PolarLineChart;

impl From<PolarLineChart> for Widget {
    fn from(_: PolarLineChart) -> Widget {
        Chart::new()
            .title("Polar line")
            .series(vec![PolarLineSeries::new("Wind")
                .data(vec![(0.0, 18.0), (45.0, 42.0), (90.0, 32.0), (135.0, 60.0)])
                .smooth(true)
                .into()])
            .into()
    }
}
Keep expensive data loading outside component conversion. A reducer, job, service, or server route should prepare the typed chart data, then the component should read that state and construct the chart deterministically.
Options, accessibility, and diagnostics
Area | What to decide | How to verify |
|---|---|---|
Data shape | Keep source rows in typed Rust structs, then map them into the series type shown in the example. | Unit test the mapping separately from rendering. |
Options | Choose axes, legends, labels, animation, and interaction based on the user's task. | Add a screenshot test when changing visual behavior. |
Accessibility | Provide a clear title and adjacent summary text for important trends or outliers. | Inspect the generated semantics and make sure the chart is understandable without color alone. |
Failure handling | Render an empty, loading, or error state before constructing the chart if data is unavailable. | Test empty data, partial data, and failed fetches. |
Performance | Prefer summarized or windowed data for very large datasets; keep full raw history in the data layer. | Profile frame time and interaction latency with representative data volumes. |
Tags: polar, line.
Previous
Polar bar
Next
Single axis