
Release timeline
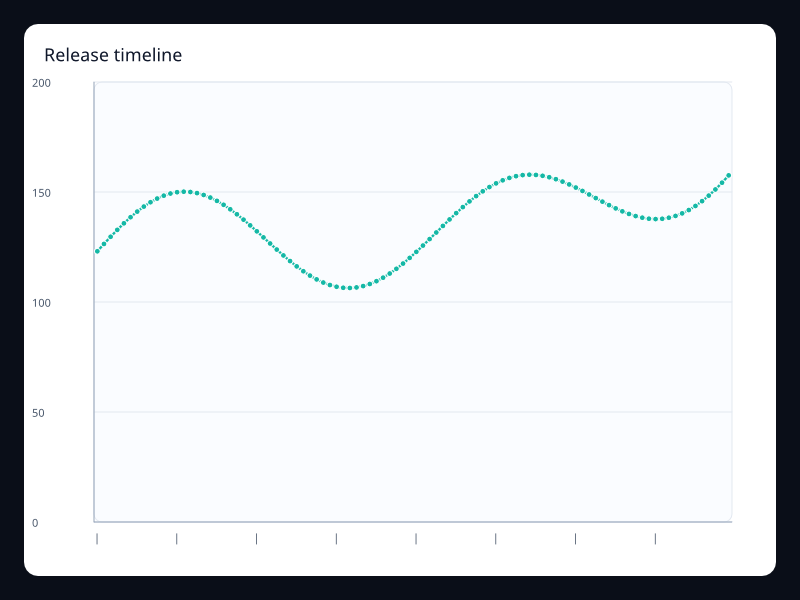
Comparing a service before and after a release requires more than changing the release label. The observations need the same units, comparable workloads and an explicit alignment between their reporting intervals. The screenshot is from Fission's chart gallery.
What the chart is for
This example compares the first hour after each of two releases. Selecting a release changes both the response-time values and the visible timeline index. The timeline is a painted indicator; it does not itself select or load another dataset.
Data model
ChartTimeline::new receives display labels and current_index identifies the selected one. The current renderer does not provide a timeline selection handler or a playback timer for play_interval_ms. Use ordinary semantic controls and reducers to own the selection.
Authoring from a Fission component
Local state is enough for this two-snapshot comparison. The parent supplies already-loaded, aligned values; a workflow which loads snapshots on demand also needs explicit loading and failure state.
use fission::prelude::*;
use fission::charts::{Axis, Chart, ChartTimeline, LineSeries};

// The parent resolves display labels from its translation bundles.
fission_component! {
    pub ReleaseResponseComparison<()> {
        props {
            chart_title: String,
            series_label: String,
            period_labels: Vec<String>,
            show_earlier_label: String,
            show_later_label: String,
            minutes_after_release: Vec<String>,
            previous_release_ms: Vec<f32>,
            current_release_ms: Vec<f32>,
        }
        state { show_current: bool = true }
    }
    view(release, _state, _cx) {
        let labels = release.minutes_after_release.iter().map(String::as_str).collect();
        let index = if release.show_current { 1 } else { 0 };
        let values = if release.show_current {
            release.current_release_ms.clone()
        } else {
            release.previous_release_ms.clone()
        };
    } => Column(children: [
        Button(
            key: "choose-release-snapshot",
            child: Text(if release.show_current {
                release.show_earlier_label.clone()
            } else {
                release.show_later_label.clone()
            }),
            on_press: reduce { release.show_current = !release.show_current; },
        ),
        Chart(
            title: Some(release.chart_title.clone()),
            x_axis: Some(Axis::category(labels)),
            y_axis: Some(Axis::value().min(0.0)),
            timeline: Some(ChartTimeline::new(release.period_labels.iter().map(String::as_str).collect())
                .current_index(index)),
            series: vec![LineSeries::new(&release.series_label).data(values).into()],
        ),
    ])
}
Testing and accessibility
Verify that the selected values and indicator change together, including repeated selections. Keep unavailable intervals explicit rather than shifting later values into their positions. Explain differences in workload outside the chart; a change after release does not on its own prove the release caused it.
Tags: monitoring, timeline.
Previous
Operational route lines
Next
Service rank