
Basic line
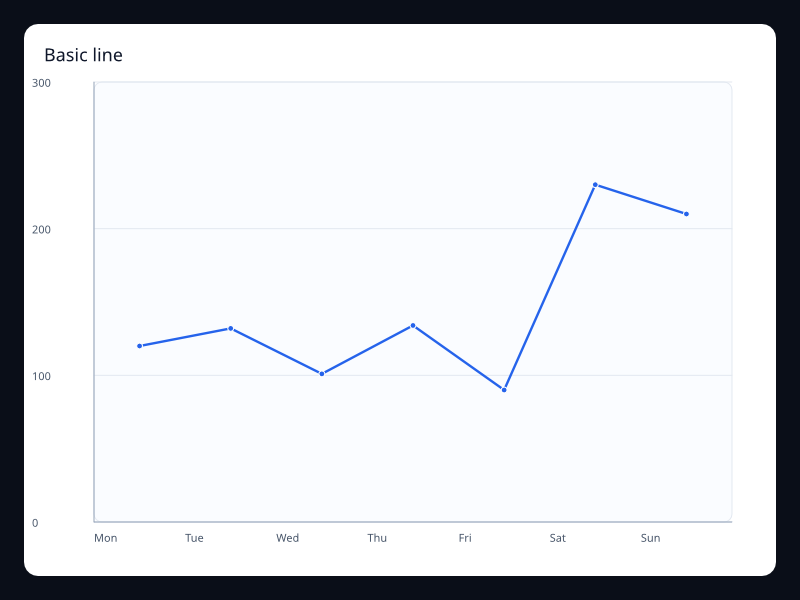
A line connects observations in order, so it makes a claim about what belongs next to what. For queue monitoring, use a complete sequence of equal sampling intervals rather than an arbitrary list of values.
use fission::prelude::*;
use fission::charts::{Axis, Chart, LineSeries, Series};

#[derive(Clone)]
pub struct QueueSample {
    pub interval_label: String,
    pub waiting_jobs: u32,
}

fission_component! {
    pub QueueLoadTrend<()> {
        props {
            title: String,
            jobs_label: String,
            samples: Vec<QueueSample>,
        }
    }
    view(load, _state, _cx) {
        let labels = load.samples.iter().map(|sample| sample.interval_label.as_str()).collect();
        let values = load.samples.iter().map(|sample| sample.waiting_jobs as f32).collect();
    } => Chart(
        title: Some(load.title.clone()),
        x_axis: Some(Axis::category(labels)),
        y_axis: Some(Axis::value().min(0.0)),
        series: vec![Series::Line(
            LineSeries::new(&load.jobs_label).data(values),
        )],
    )
}
The parent supplies translated labels and a ready snapshot. Put these definitions in widgets/queue_load_trend.rs to reuse them from the dense-line example. Loading stays in effects and reducers.
Category positions are equally spaced. Changing the axis type does not give this Vec<f32> projection irregular timestamp positions; use an appropriate explicit coordinate representation for that requirement.
Test ordering, a single sample and an empty history. An unavailable reading is not an idle queue: do not replace it with zero or silently connect across a gap and call that complete telemetry. Show exact observations and the sampling interval beside the chart. The image uses gallery data.
Previous
Basic bar
Next
Grouped bar